Companies Are Increasingly Relying on Generalists for Their BI & Analytics Software
- BARC surveyed 1,951 people worldwide for The BI & Analytics Survey 23.
- The largest survey of BI and analytics users provides valuable insight into software selection and usage as well as customer satisfaction.
- 24 leading software products were evaluated in detail.
BARC publishes The BI & Analytics Survey 23, the world’s largest survey on business intelligence (BI) and analytics software, based on feedback from 1,951 users. The survey compares 24 leading software products, highlights current market trends, and evaluates best practices for selecting and deploying BI and analytics software.
The world’s largest user survey on business intelligence software
The BI & Analytics Survey 23 shows that the market for BI and analytics tools remains highly competitive and difficult for buyers to navigate. It is notable that buying criteria that are easy to assess, such as functional scope and costs after implementation, do not necessarily lead to business benefits. Instead, criteria such as scalability and fast response times should be prioritized when selecting software. This is shown by directly comparing users’ expectations of solutions and actual satisfaction after implementation. For example, some front ends that claim to be scalable are not capable of processing large volumes of data in productive use.
In addition to comparing the reasons for purchase and problems experienced, The BI & Analytics Survey analyzes the areas of the company in which BI and analytics products are used and the purposes for which they are used. It reveals the strengths and weaknesses of market-leading products such as Microsoft Power BI, Tableau and Qlik, as well as smaller and emerging vendors.
Choosing and buying BI software
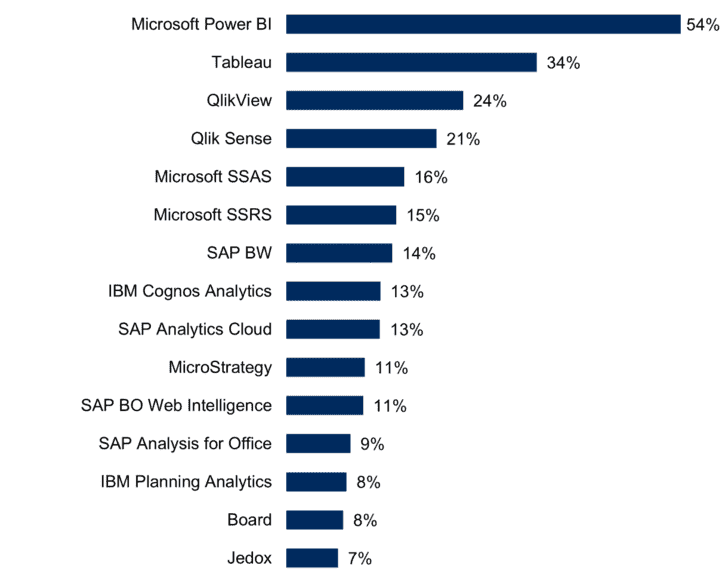
Self-service BI and analytics solutions are currently in vogue. Of the five products most often considered for purchase recently, four are often associated with self-service. This shows that supporting an approach that spreads analytics content creation across many shoulders remains a critical factor in purchasing decisions. Nonetheless, buyers’ attention is shifting from isolated self-service applications to platforms that provide governed self-service capabilities to ensure high quality and efficiency in content creation.

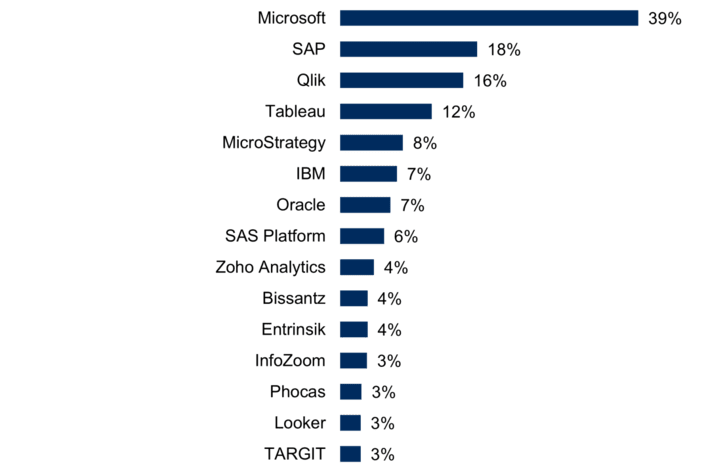
A look at the most purchased BI products by vendor shows that Microsoft clearly dominates. It should not be overlooked that Microsoft often sells multiple products to a single customer. This also applies to SAP, which takes second place when sales of all its products are combined. SAP is just ahead of Qlik and Tableau. In addition to IT giants such as IBM and Oracle, specialists such as SAS and Bissantz can also be found in the top ten (see Figure 2).
In general, it can be observed that BI and analytics specialists have been increasingly evaluated in the last two years, but often lose out to software suite providers or hyperscalers when it comes down to the software selection decision.

Fast implementation for better results
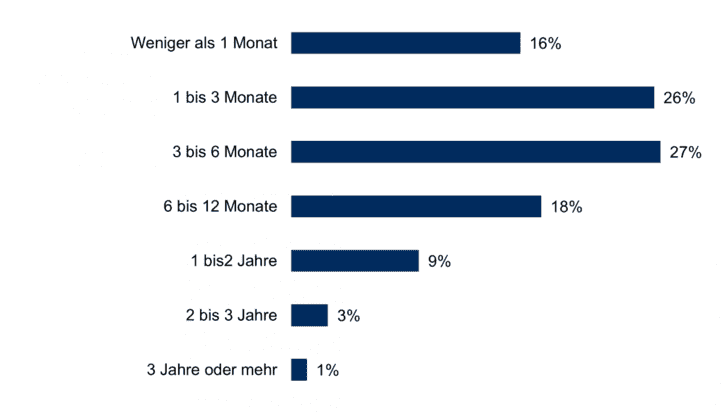
The average implementation time for BI software is 3.9 months. Of course, particularly large or complex projects tend to take longer. Nevertheless, fast implementations are an important source of satisfaction, and they clearly correlate with the business benefits achieved, as evidenced by the study results.
The average implementation time for projects started less than two years ago is 3.8 months, compared with 4.0 months for older projects. This shows that changes in technology (e.g., the cloud) and project methodology are enabling customers to deploy solutions faster and achieve benefits more quickly (see Figure 3).

BI and analytics are still not ‘democratic’ enough
Successful decision support in modern companies requires democratic access to data. Decision-makers in all departments need up-to-date and relevant information to base their decisions and actions on a reliable foundation. BI and analytics should be actively used by data-savvy employees across the enterprise whenever possible.
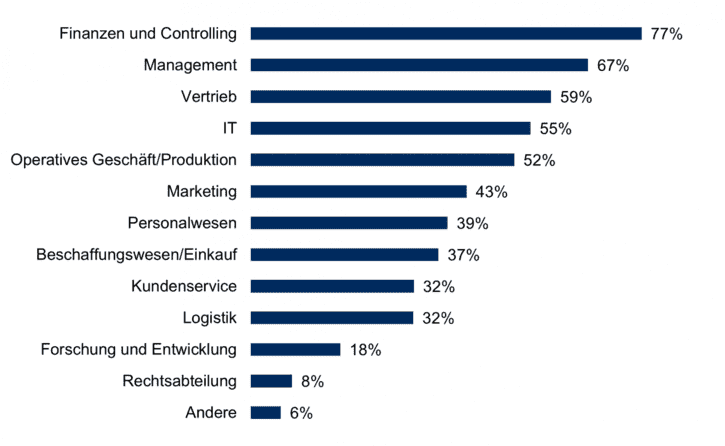
However, the results of the survey show that beyond finance and controlling – 77 percent of the companies surveyed use BI and analytics there – other departments that rely heavily on data, such as sales (59 percent) and operations (52 percent), lag behind significantly (see Figure 4).

About the survey
The BI & Analytics Survey 23 provides a detailed quantitative analysis of why customers buy BI tools, what problems they have with the tools, and how successful they are in meeting project goals. The results of The BI & Analytics Survey 23 are presented in several documents, each focusing on a specific group of BARC survey findings. The BI & Analytics Survey Analyzer contains information on all results and key performance indicators (KPIs) from The BI & Analytics Survey. This online tool allows users to perform their own analysis of the entire survey data set. It is also possible to filter the results by region, company size and other criteria. A concise overview of the results of the individual products can be found here. https://bi-survey.com/business-intelligence-software-comparison
