Find out what opportunities and risks GenAI brings to the enterprise BI & Analytics market, and what to look for when selecting software.
The market for Enterprise BI & Analytics has reached a significant level of maturity, with platforms that offer robust core functionalities, such as reporting and dashboards, delivered with high quality. Today, differentiation among vendors increasingly hinges on specialized features and industry or department specific offerings. However, the emergence of Generative AI (GenAI) presents a strong opportunity to enhance software capabilities and gain a competitive edge.
GenAI: A Beacon of Hope for Many BI & Analytics Users
Generative AI, which involves the application of AI features based especially on large language models (LLMs), significantly enhances modern BI platforms. It enables natural language interaction not just with the BI platform itself but also with the underlying data. This technology is particularly beneficial for occasional users, helping them find the right data more quickly and extract high-quality insights, thereby making business intelligence more accessible and effective for a broader audience.
A few years ago, vendors that excelled at implementing Natural Language Query (NLQ) could differentiate themselves from the competition. However, the advent of LLMs has surpassed the capabilities of standard NLQ solutions, making them less competitive. LLMs offer a greater versatility that makes it possible to go far beyond chatbots.
Today, GenAI in BI & Analytics solutions has already surpassed basic NLQ, although many vendors are still developing new features. Numerous BI & Analytics providers are currently working on agents or assistants that enable users to interact with BI & Analytics tools in natural language, sometimes even via voice input. These agents aim to support not only end users but also power users and business analysts in tasks such as creating visualizations, reports, dashboards, and generating “stories” (compelling data storytelling reports). For data engineers, features like writing code in SQL or Python or creating data pipelines are on offer.
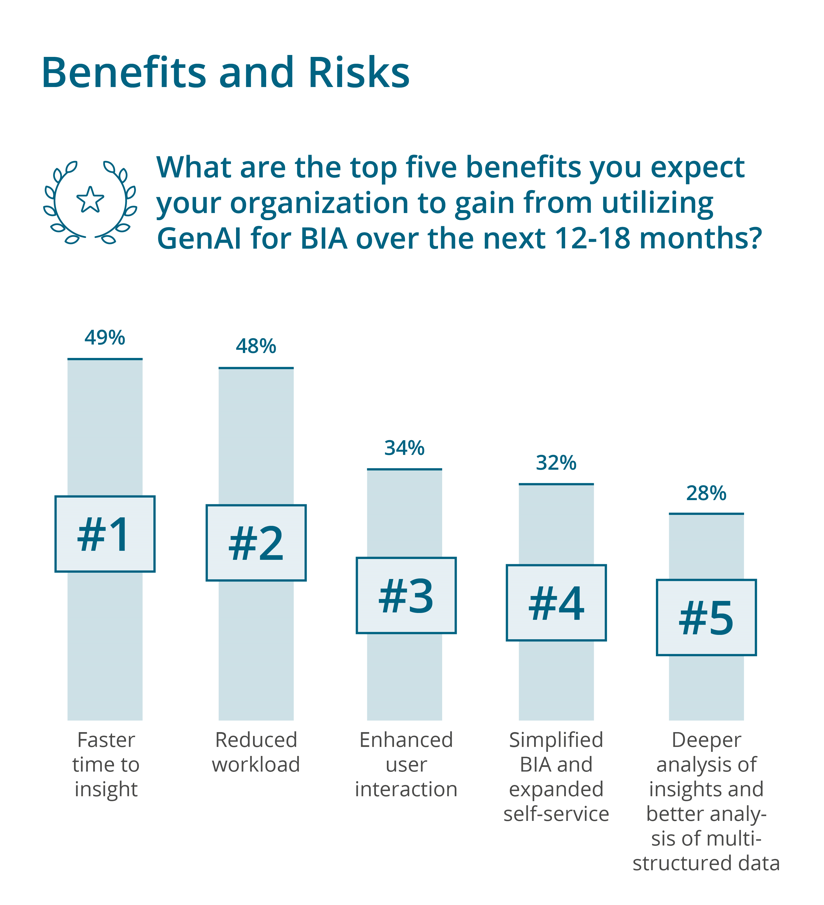
Figure 1: BARC Survey “The Future of BI & Analytics – Adopting Generative AI for Analytics”, n=238
A recent BARC survey shows that users already expect these offerings. The use of GenAI can expedite certain tasks, allowing data analysts and consumers to reach insights more efficiently (shorter “time to insight”) while reducing the workload on analytical teams (see figure 1). The survey also indicates that business users see significant potential in GenAI, as it is expected to improve efficiency, simplify access to BI and analytics, and expand the scope for self-service analytics – a sentiment shared by 32% of respondents. Data engineers also recognize the benefits, particularly in reducing their workload through automation. In contrast, power users and data scientists are more skeptical. Since these user groups typically work with BI & Analytics software on a day-to-day basis, they have established efficient point-and-click workflows or programming steps. A language input that still frequently requires corrections and multiple input parameters to achieve necessary accuracy is seen as a backward step in efficiency by power users.
Quality of GenAI Implementations Varies
The technical implementation of GenAI features is carried out through agents responsible for orchestrating the various technologies involved. These include LLMs themselves (for understanding natural language input and generating output) and other technologies like vector and graph databases, which enable the generation of reliable answers within the correct context.
Products based on a semantic layer have significant advantages here: a semantic layer represents complex data structures in familiar business concepts, closer to the natural language of users, helping the LLM map the user’s intent to the data set. This significantly reduces the LLM’s margin of interpretation, resulting in more reliable outcomes.
This reliability is crucial, as every enterprise BI & Analytics platform is required to produce trustworthy reports – provided the underlying data is of appropriate quality. GenAI features will also need to meet this high standard in practice.
Advancements and Specialization of Modern BI & Analytics Platforms
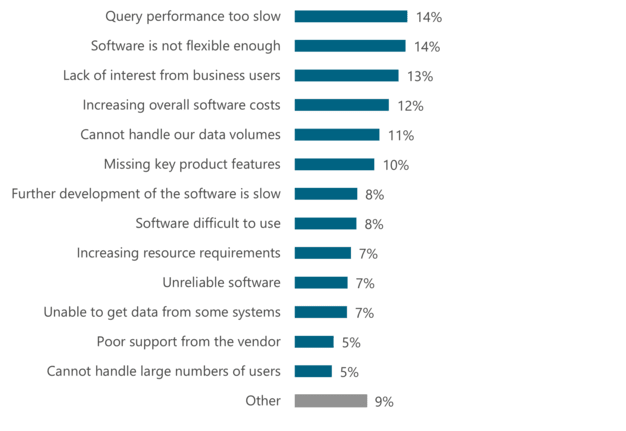
In addition to many vendors investing in GenAI as a means of modernization and differentiation, numerous specialized tools in the BI & Analytics market have evolved into comprehensive enterprise BI & Analytics platforms. The numbers from our BI & Analytics Survey reflect this trend: only 10% of participants cite a lack of core features as the most serious issue with the software they use (see figure 2).
Figure 2: BARC BI & Analytics Survey, Frage: What are the most serious problems you have encountered using your product? Filtered by software-related issues, n=1,243
This finding shows that functional differentiation in core areas is increasingly challenging. According to the BARC BI & Analytics Survey, dashboards, reporting, and analysis are the core features that every tool must cover. Consequently, differentiation through diversified functions or targeted messaging is gaining importance. BI & Analytics vendors are attempting to carve out niches, such as specific industries (e.g., finance, manufacturing) or functions (e.g., visual data science, printed reports). Additionally, the connection to proprietary source systems or those of strategic partners remains a key marketing argument for software providers, reflected in the functional focus of their products.
BI & Analytics vendors cover these diverse requirements with their varying strengths and orientations, offering a wide range of solutions for different user groups.
The BARC Score Enterprise BI & Analytics Platforms: A Reliable Market Overview
The BARC Score Enterprise BI & Analytics Platforms highlights the differences among leading vendors in this segment. This comprehensive evaluation, conducted for the tenth time by independent analysts, offers a reliable overview of the market. The BARC Score assesses and compares 19 of the world’s most important vendors of modern enterprise BI & Analytics platforms. Two vendors that were part of the market overview in previous years no longer meet the inclusion criteria.
The core of the BARC Score is a two-dimensional matrix. On the y-axis, we assess Market Execution, evaluating how successfully an organization and its partners market, sell, implement, and contribute to project success with the software. On the x-axis, we assess Portfolio Capabilities, evaluating the functionality of the software.
The BARC Score serves as a tool for companies looking to select a new BI & Analytics tool or evaluate their existing investments. According to the BARC BI & Analytics Survey, 62% of surveyed companies conduct a competitive evaluation when selecting software. The study also clearly shows that these companies achieve more business benefits from using professional software, leading to long-term success in their BI & Analytics initiatives.
The BARC Score can aid in the software selection or validation process by providing a solid foundation for creating long- and shortlists or comparing vendors. You can find the study on our website www.barc.com/score.
BARC Recommendations for BI & Analytics Solution Buyers
Are you in the market for a suitable BI & Analytics solution? Our checklist below will support you in taking a structured approach and help you keep track of the extensive vendor market throughout your project.
Define the Project Scope: Once you have identified a software need, define the project scope, including the application scenarios the software should cover. Afterward, assess which company departments will be impacted by the software decision and which might also benefit from the software purchase.
Define Project Participants: It is a best practice to involve a representative mix of different user groups and stakeholders in the software selection process. Decision-makers and project sponsors are important to gain approval for the software purchase and streamline the necessary decision-making processes. Software users, who will be the primary actors in the future, should also be involved. A mix of various user types (end users/consumers, power users or business analysts, IT, etc.) has proven effective.
Gather Requirements: Once the general project setup is complete, gather the software requirements by deriving them from the future application scenarios. Project stakeholders can be engaged through questionnaires, interviews, or workshops. It is important to ensure a mix of general criteria (e.g., vendor), organizational, functional, and technical aspects to develop a comprehensive understanding of the requirement landscape.
No software can meet all your requirements. Project participants should weigh which criteria are more critical than others, prioritizing and defining “showstoppers,” or key criteria that must be met.
Get an Overview of the Market: Once you have gathered the requirements, obtain an overview of the market segment and the solutions operating within it. The annually updated BARC Guide Data, BI & Analytics offers one of the most comprehensive insights into the DACH market, while various BARC Scores evaluate targeted market segments..
Define a Longlist: Based on the gathered requirements, create a longlist of potentially suitable solutions – for example by using a BARC Score, such as the BARC Score Enterprise BI & Analytics Platforms.
Define a Shortlist: Evaluate the vendors on your longlist against your showstopper (or knockout) criteria. Then you can proceed with a more detailed examination of the remaining list.
Conduct a Detailed Evaluation: You should thoroughly vet the vendors on your shortlist in a “beauty contest” (an external implementation) or a proof of concept (an in-house implementation).
Choose an Implementation Partner: After finalizing communication with the software vendor and deciding on a BI & Analytics solution, select an appropriate implementation partner.
If you want to conduct the selection process quickly and with focus, BARC, as an independent market analyst, offers assistance through all the mentioned steps with our tried and tested software selection methodology.
Don‘t miss out!
Join over 25,775 data & analytics professionals and get the latest product insights, research, surveys and more!
Florian is an Analyst for Data & Analytics with a focus on Data Management. His primary interests include topics such as Data Catalogs, Data Intelligence, Data Products, and Data Integration.
He supports companies in selecting suitable software solutions, analyzes market developments, addresses the needs of user organizations, and evaluates innovations from software vendors.
As a co-author of BARC Scores, Research Notes, and Surveys, he regularly shares his insights and expertise. He frequently moderates events on data management topics. He is particularly fascinated by the rapid pace of technological advancement and the central role of data management in enabling the success of forward-looking technologies such as artificial intelligence.
Larissa Baier is a Senior Analyst in the Data & Analytics field, combining expertise in consulting projects and research. She supports end customers with strategic questions regarding BI and analytics front ends, including architectural design, usage scenarios, and software selection. Her focus lies on BI and analytics front ends for dashboards, reporting, analysis, planning, self-service analytics as well as GenAI Copilots. A particular area of expertise lies in assisting SAP customers in deriving added value from their data.