

The new BARC Benchmark provides objective comparisons between leading analytical platforms.
BARC has released the first installment of its new “BARC Benchmark”, introducing a reproducible methodology for evaluating the real-world performance of data and analytics platforms based on real-world enterprise scenarios. In the first available comparison, Microsoft Power BI and Qlik are benchmarked in its standard cloud-based editions.
The benchmark results provide enterprises with clear, data-driven insights into productivity, response times, and scalability – critical factors as performance increasingly defines user satisfaction and business value.
Unbiased Source for Optimization of Deployments
As end users increasingly expect real-time responsiveness, driven by their experience with consumer apps and AI tools, the ability of BI platforms to deliver predictable, scalable performance has become a key differentiator
Rather than relying on traditional feature checklists, the BARC Benchmark focuses on what really matters: measurable outcomes in speed, throughput, and reliability.
“The BARC Benchmark is designed to compare leading analytics platforms on performance, productivity, and scalability – factors that are becoming critical for user acceptance,” said Thomas Zeutschler, co-author of the study and Senior Analyst at BARC. “With this new methodology and testing framework, we provide enterprises with an unbiased foundation for selecting the right platform and optimizing their deployments.”
The tests were conducted anonymously with numerous repetitions to obtain unbiased results in real cloud environments and included several hundred thousand simulated user actions. The test methodology is based on a comprehensive BARC benchmark standard data model, which will also be used in other system environments in the future using a standardized procedure.
Sample Finding: Performance when Changing a Report Filter
The study examines the behavior of the platforms in various scenarios, such as opening reports, updating or changing filters. The sample shows the response times, grouped according to different test scenarios with an increasing number of users in the system.
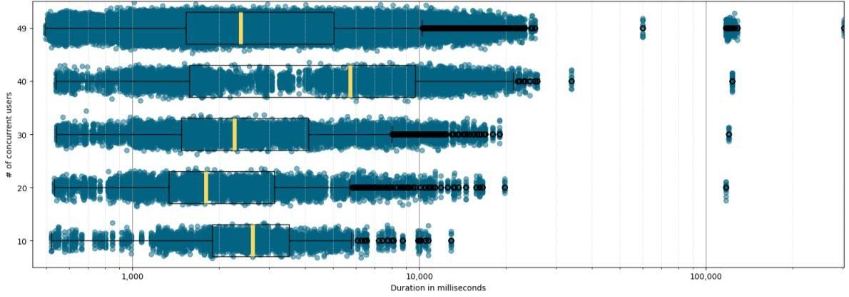
Figure 1: PowerBI – User Load Behavior Duration in milliseconds for action ‘changeReportFilter’ per # of concurrent users
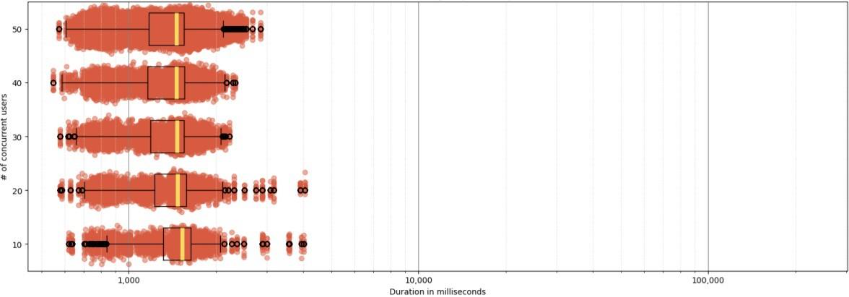
Figure 2: Qlik – User Load Behavior Duration in milliseconds for action ‘changeReportFilter’ per # of concurrent users
Setting a New Standard
The BARC Benchmark series represents a long-term commitment to transparency and industry-wide collaboration. Future editions will expand the scope to include more platforms, larger data volumes, and broader use cases. BARC invites enterprises, consultants, and vendors to review the methodology and contribute feedback to shape the benchmark’s next stages.
Access the Full Report
The complete first edition of the BARC Benchmark report including methodology, detailed findings, and recommendations is now available here.
