This article breaks down why traditional data management is a bottleneck and explains how knowledge graphs provide the essential context for building truly intelligent, scalable AI.
The New Hire and the Customs Nightmare
Meet Alex, a new junior supply chain analyst. A crisis lands on his desk during his first week. A supplier reports a customs issue with a critical component, threatening a production delay. The standard checklist on the company wiki is silent on this specific problem. The onboarding manual is no help either. An old Slack thread offers only contradictory advice. Alex ends up asking two senior colleagues for help while simultaneously digging through the ERP system for similar incidents – cases scattered across years of data, filled with cryptic comments.
Alex painstakingly pieces the required knowledge together from documents, conversations, and different systems. He builds a mental map of facts and potential solutions. Only when the connections become clear can he propose a course of action, which his manager immediately approves.
This scenario is impressive and typical for many knowledge-intensive processes, but it’s also a bottleneck. This way of working depends on time, experience, and intuition. It doesn’t scale.
What if an AI agent could do this work instead?
Why Traditional Data Management Fails
An AI agent would need to approach the problem just like Alex did: by combining different forms of knowledge. It would have to connect structured ERP data with unstructured documents, link standardized SOPs with chaotic chat logs, and map past decisions to their outcomes.
This is where traditional systems hit their limits.
Relational databases provide precise answers to clearly defined questions. They know an order was stopped, but they don’t know why. They don’t understand the broader context of the data they hold. The invaluable experiential knowledge from colleagues remains invisible to these systems, existing only in people’s heads and conversations.
Semantic Search: A Good Start, But Not Enough
To make both structured data and distributed knowledge useful, the common solution is semantic search powered by vector databases. This approach is good at finding similar text passages in documents, and chatbots using this method can achieve a respectable 80 – 90 % accuracy.
The final 10 – 20 %, however, is the real challenge. Semantic search operates on similarity. It can tell you that two SOPs cover the same topic, but not whether they build on each other or contradict one another in critical details.
We leave this missing context up to Large Language Models (LLMs), expecting them to infer logical connections from text fragments and identify conflicting information. But the models themselves often lack this overarching context—knowing which documents complement or contradict each other, or the priority of different sources—because it isn’t explicitly stated in the text.
Graphs: The Missing Connecting Element
For years, experts have pointed to graph databases as the solution. They don’t just store data points; they store the relationships between them. It is these relationships that make knowledge tangible and actionable.
Let’s go back to Alex’s customs problem. The information about the stopped order is in a relational database. The reason—a missing certificate of origin—is buried in a PDF attachment. The escalation was documented via email, and the supplier block is noted as a status change in the ERP. What’s missing is the element that connects them all.
A knowledge graph can link these fragments and put them in context: the component belongs to a safety-critical product; the escalation was made after consulting the quality department; a similar case occurred in 2022 and was resolved with express shipping; and a little-known SOP in the wiki governs this exact exception.
An agent can systematically traverse, combine, and validate these relationships—just like Alex, but automatically, faster, and at scale.
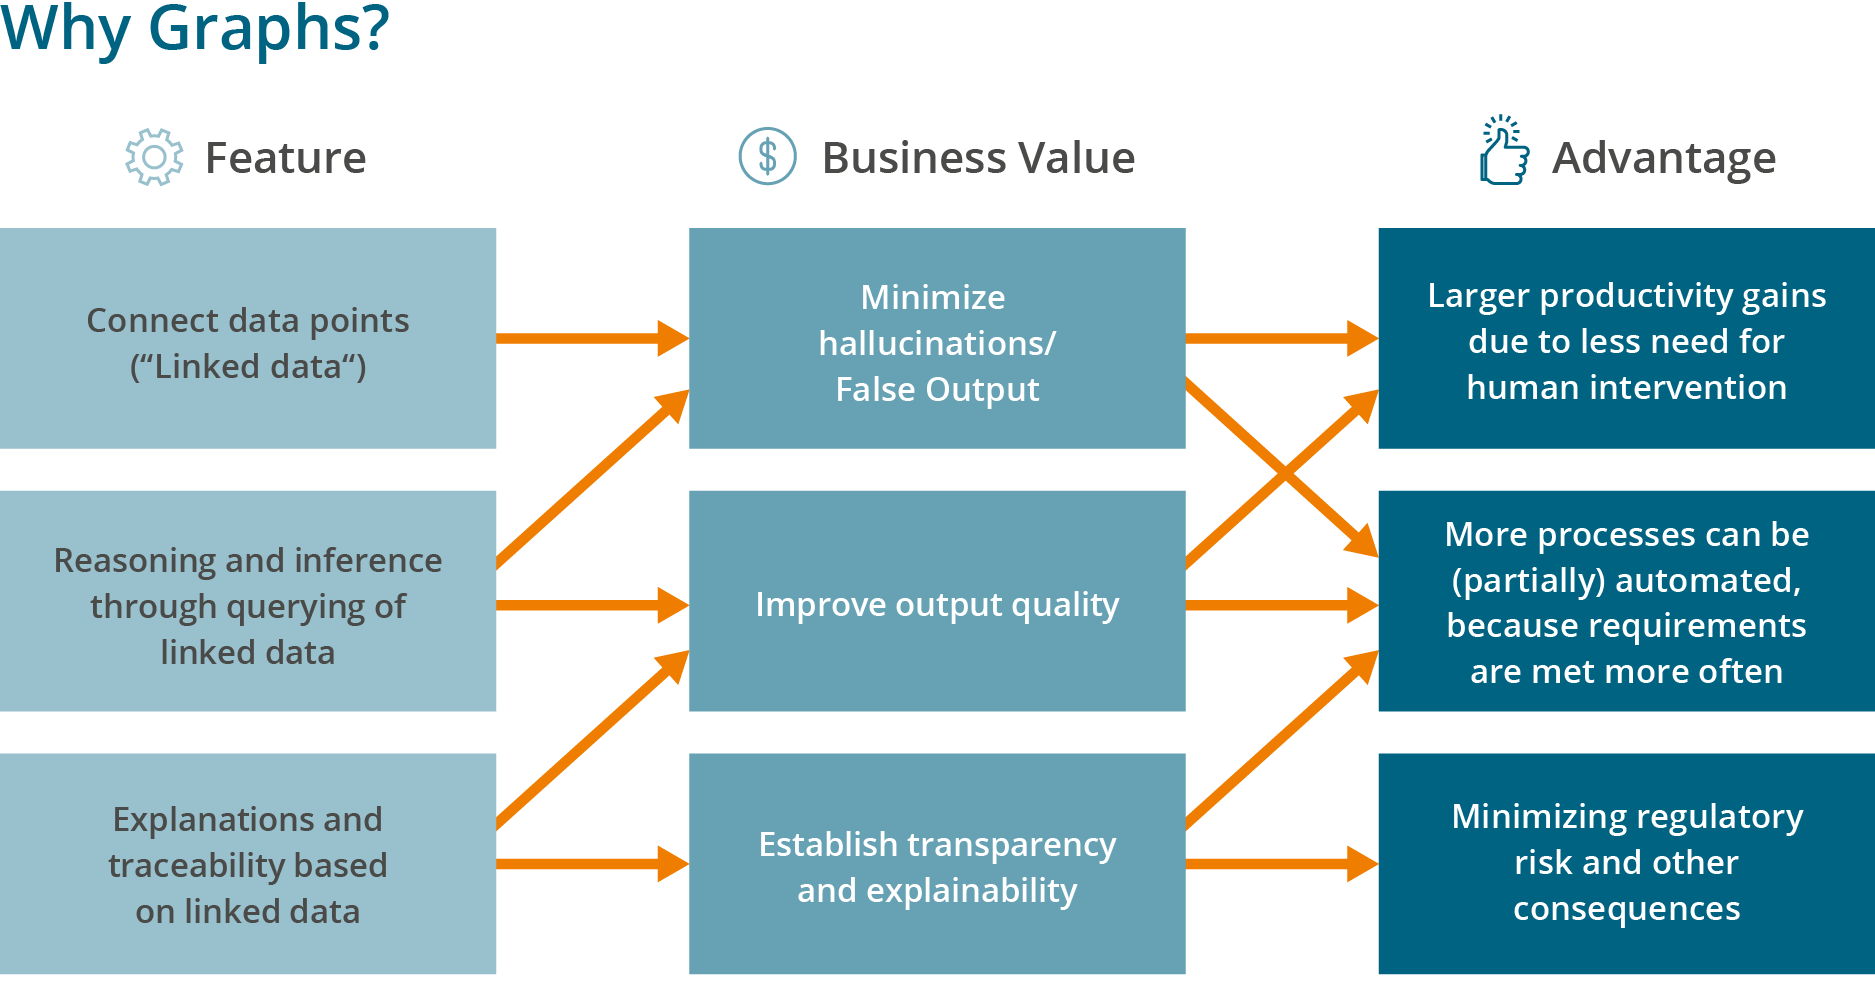
Fig.1: The features of a graph are initially abstract but can be translated directly into monetary value in the age of agentic AI.
Graphs deliver true semantic meaning because meaning lies in the relationships between entities. When we formally capture this knowledge, AI applications can use it. While this can’t eliminate hallucinations entirely, it can effectively prevent them.
The Graph Database Market: Key Players
The graph database market is specialized but well-established, with an estimated market size of around $1 billion in Annual Recurring Revenue (ARR). The ecosystem also includes specialized vendors building solutions on top of graph databases and open-source alternatives like JanusGraph and NebulaGraph.
Here are the most important players at a glance:
Neo4j (USA, 930 employees): Market leader in the LPG space.
TigerGraph (USA, 133 employees): Specialist in scalable LPG graphs.
Stardog (USA, 86 employees): Focus on RDF and enterprise semantics.
ArangoDB (Germany, 76 employees): Multi-model database with strong graph capabilities.
Amazon Neptune: Managed service for both LPG and RDF.
Oracle Spatial & Graph: Enterprise integration within the Oracle ecosystem.
Beyond the databases themselves, Enterprise Knowledge Management platforms from vendors like eccenca (Germany), Fluree (USA), and Graphwise (Austria) build on these technologies to deliver graph-based solutions for AI. While all three employ around 50 employees, eccenca is a well-established player in the market, Fluree a growing startup, and Graphwise a new, unique joint venture of knowledgeable firms.
Technological Approaches: LPG vs. RDF
Labeled Property Graph (LPG): An LPG is a flexible model where nodes and edges can have properties and labels. It’s often used where data structures change quickly and rapid iteration is important.
Resource Description Framework (RDF): RDF emphasizes structure, standardization, and interoperability. It is used to define a foundational semantic model for long-term use, such as a knowledge graph describing a company’s core activities or the relationship between critical data sources
Why Haven’t Graphs Already Saved Us?
We would like to thank eccenca and Neo4j for their valuable contributions, including materials and use cases, which have deepened our understanding of market developments during analyst briefings. As an independent market analyst, BARC places great importance on maintaining a comprehensive view of the market and therefore engages with many other vendors as well.
More than two years after the debut of ChatGPT, where are the graphs? They exist, but often only in isolated pockets within the pharmaceutical, healthcare, and defense industries. These are exceptions compared to the flood of RAG chatbots fed by vector databases.
The companies finding success started their modeling work years ago. They invested not just in technology, but in skills and a willingness to make internal knowledge explicit.
Four hurdles consistently prevent organizations and their CDOs from investing the necessary time and resources in graphs:
No Immediate ROI: Relational tables answer most operational questions quickly. The value of a graph often seems abstract and far in the future, while the effort to populate it is immediate.
High Barrier to Entry: Business users are familiar with processes and KPIs. Thinking in terms of nodes and edges requires a new mindset. Graph modeling takes time without producing instant, visible results.
The Tool Ecosystem: Nearly every BI tool supports SQL. Support for graph query languages like Cypher or SPARQL is rare. Skills are scarce, and training takes time.
Budget Cycles: Investments with a short-term return get priority. Graphs deliver value over the long term, which is a difficult case to make in annual budget reviews.
AI Agents Need to Be Onboarded
If AI agents are to become our colleagues, they need the same onboarding that humans do. Imposing semantic discipline costs time upfront, but it pays off multiple times over. Processes become transparent, recurring questions are answered automatically, and new use cases can be added easily.
The promise of “ChatGPT, build my graph!” is becoming more common. In practice, however, these tools mostly extract entities and relationships from unstructured text to create a graph from available knowledge fragments. This is a helpful step, but it is not a complete model of meaning. The contribution of human experts from different business areas is what makes the difference.
Whether you approach it automatically, manually, or with a hybrid method, the goal requires a shift in thinking: we must learn to externalize our knowledge. The vision of an AI agent that absorbs all knowledge from IT systems, phone calls, and coffee-machine chats is still a long way off.
A Pragmatic Start
Getting started doesn’t have to be expensive or complicated. Begin with a trusted vocabulary—a central business glossary. Defining just 30 to 50 core business terms and their relationships is enough to demonstrate value and test the technology and the mindset. This work often reveals that terms are used inconsistently and that harmonization is a valuable exercise in itself.
This investment doesn’t just benefit the next generative AI application. It pays long-term dividends for all knowledge work and lays the foundation for a sustainable data ecosystem. The question isn’t whether you need a knowledge graph. The question is: When will you start onboarding your AI agents properly?
Don‘t miss out!
Join over 25,775 data & analytics professionals and get the latest product insights, research, surveys and more!
Florian is an Analyst for Data & Analytics with a focus on Data Management. His primary interests include topics such as Data Catalogs, Data Intelligence, Data Products, and Data Integration.
He supports companies in selecting suitable software solutions, analyzes market developments, addresses the needs of user organizations, and evaluates innovations from software vendors.
As a co-author of BARC Scores, Research Notes, and Surveys, he regularly shares his insights and expertise. He frequently moderates events on data management topics. He is particularly fascinated by the rapid pace of technological advancement and the central role of data management in enabling the success of forward-looking technologies such as artificial intelligence.
DATA festival Online. Experience Data & AI with the community shaping what’s next.