




Measuring Data Quality
Data Quality metrics quantify performance for defined data sets, data elements, processes, or use cases.
Measurement starts with the requirements of ause case. Consider a B2B e-commerce company that processes orders through its online shop. Each customer order requires a primary email address.
The next step is to classify this requirement by data quality dimension. Common dimensions include accuracy, completeness, consistency, timeliness, validity, uniqueness, and relevance. In this example, the company needs to determine whether every order includes a primary email address. The relevant dimension is therefore completeness.
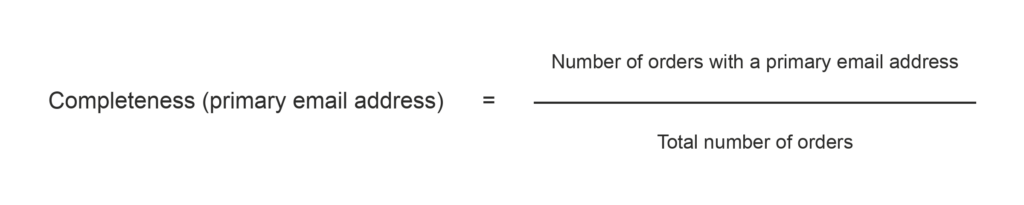
The company can measure completeness with a simple ratio: the number of orders with a primary email address divided by the total number of orders. The result ranges from 0% to 100%.
As data engineers work through the requirements of a business domain, they will define many metrics. Some will matter more than others. Some will reveal broader trends. In this example, the total share of invalid order records could provide a wider view of data quality. A metric that tracks such an important management objective can serve as a key performance indicator (KPI).
Rules and checks produce the underlying measurements. A rule states a testable condition for defined data. For example:
The primary email address field in each order record must not be empty.
A check evaluates whether the data meets that condition, for example through an SQL statement or Python script. In this case, the check returns a value of 0 or 1 for each record. The metric aggregates these results across the relevant population.
What is a data quality metric?
- A data quality metric quantifies performance for a defined data set, data element, process, or use case.
- A KPI is a selected metric tied to an important management objective.
- A rule states a testable condition. A check executes that rule.
- A target defines the desired performance. An escalation threshold marks the point at which attention or action is required.
- A scorecard presents selected measures together.
What are the main data quality dimensions?
Data quality dimensions provide a structure for defining requirements and analyzing problems:
- Accuracy: A value or record is correct when compared with a reliable reference or ground truth.
- Completeness: All mandatory attributes of a record are filled. Completeness can also describe whether a table contains all relevant records (row completeness vs. column completeness).
- Consistency: Different data points do not contain contradictions. Consistency is always relative. It can apply between attributes in one record, between records, between tables, or across systems.
- Timeliness: A record is current enough for its intended use. Because many systems process data in batches rather than in real time, timeliness requires a meaningful threshold.
- Validity: Data conforms to defined constraints, rules, and technical requirements. Checks range from simple format tests, such as whether an email address is valid, to business rules, such as whether the delivery date follows the order date.
- Uniqueness: A record exists only once and has no duplicate that could cause unintended outcomes, such as executing the same order twice.
- Relevance: Data is meaningful for the user’s specific task.
These dimensions may appear clear, but they are not equally important in every context.
In our BARC Survey on Managing Unstructured Data (2026, n=195), BARC analysts Kevin Petrie and Merv Adrian asked, “How do you measure the AI readiness of unstructured data?” Among respondents, 54% named accuracy, while 31% named timeliness. The other dimensions listed above fell between these values. For a closer look at how AI changes these requirements, read our article on data quality for AI.
More important, the same data may be good enough for one purpose and unfit for another. Data quality dimensions are not useful in isolation. They provide a mental model for analyzing requirements and issues and for defining processes, metrics, rules, and checks. There is no one-size-fits-all definition of high-quality data.
How to choose metrics for business-critical data
- Name the business decision, process, report, or AI use case.
- Identify the critical data elements whose failure could change the outcome.
- Describe the consequence of failure and define what fit for purpose means in this context.
- Select only the dimensions that reveal material failure modes.
- Define the rule and the checks needed to test it.
- Define the metric, including how it is calculated and reported and what happens when a threshold is crossed.
- Name the person who reviews the result and the decision it informs.
- Confirm that the metric is understandable, reproducible, sensitive to material change, and economical to maintain.
Set baselines, targets, and escalation thresholds
A metric on its own is an abstract number. It needs context to guide decisions.
Typical reference points include:
- Target: The desired value or range.
- Baseline: The initial or typical performance level.
- Threshold: A boundary between performance ranges that shows how serious a result is.
- Warning: A notification or automated action triggered when a threshold is crossed.
Use warnings carefully. Too many irrelevant alerts create notification fatigue and make material problems harder to detect. Starting the day with a coffee and 20 irrelevant data quality warnings is frustrating for the data steward and wastes time.
Defining this context takes detailed work, even for a simple metric. The result helps teams distinguish normal performance from a situation that requires action.
Do not review only the latest value. Track the metric over time to identify deterioration before a threshold is hit, anomalies, and periodic effects.
Practitioners now apply continuous measurement and anomaly detection across their data estates. This approach resembles machine telemetry and the observability practices used in other IT systems. To learn more about data observability, read BARC’s survey-backed report: Observability for AI Innovation – Adoption Trends, Requirements and Best Practices
What should you do with data quality metrics?
Defining metrics, thresholds, and notifications takes time. Using them to improve business outcomes is harder. The data quality management lifecycle helps connect measurement with business impact and organize the work required to improve data quality. Read more about how to operate this lifecycle in the article about data quality management.
Data Quality Management Is Changing
Data quality management has ranked among the leading topics in the BARC Data, BI, and Analytics Trend Monitor for several years. This sustained position shows that many organizations still struggle to protect the reliability of data-driven decisions.
The field is changing. To stay up to date, read the BARC Compass Data Quality Management. It explains eight processes and technologies that shape the discipline right now, places these developments in the context of BARC primary research, and lists relevant software vendors to guide software selection decisions. Teams evaluating tool support can also compare data quality solutions in BARC’s reviews of data quality and observability offerings.
FAQ
What are data quality metrics?
A data quality metric quantifies how well a defined data set, element, or process meets the requirements of its intended use. Each metric belongs to a dimension, such as accuracy or completeness, and is computed from rules and checks that test the data directly. The share of customer orders with a primary email address, for example, measures the completeness of that attribute.
What are the main data quality dimensions?
The most common dimensions are accuracy, completeness, consistency, timeliness, validity, uniqueness, and relevance. Each answers a different question. No single dimension captures quality on its own. In our 2026 survey on unstructured data (n=195), respondents combined several dimensions to assess AI readiness. Accuracy reached 54%, while timeliness reached 31%. The use case determines which dimensions matter.
How do you measure data quality?
Start with the business decision, process, report, or AI use case. Identify the critical data elements whose failure could change the outcome. Select the dimensions that reveal those failure modes. Then define a rule, the checks that test it, and a metric that aggregates the results through a documented calculation. Finally, set a baseline, target, and escalation thresholds, and assign a named reviewer.
What is the difference between a data quality metric, KPI, rule, and threshold?
A rule states a testable condition. For example, the primary email address must not be empty. A check executes that rule for each record. A metric aggregates the results into a single value, such as the share of orders with an email address. A KPI is a metric tied to an important management objective. A threshold marks the value at which a warning or defined response is triggered.
How should an organization set data quality thresholds?
Base thresholds on the consequences of failure, including affected users, revenue, operational risk, and regulatory exposure. A warning threshold should prompt review. An escalation threshold should trigger a defined response. Test each threshold for false positives and false negatives. Overly sensitive alerts create noise and can hide the failures that matter.