Bissantz DeltaMaster
What is Bissantz DeltaMaster?
Integrated product for (advanced) analysis, reporting, dashboards and planning. Vast array of intelligent analysis functions for large data volumes (including statistical and advanced analytics methods) and innovative chart types for data-dense reports and dashboards.
About Bissantz DeltaMaster
The information in this section has been provided by the vendor of Bissantz DeltaMaster.
Self-description of the vendor
Business Intelligence without compromise
Experience your data with maximum clarity and business logic: in DeltaMaster, our power tool for analysis, planning and reporting, and the DeltaApp for anyone who wants to know how their company is doing anytime, anywhere. With Bissantz you have your key figures under control!
- Analytical reporting
- Planning, forecasting, simulation
- Business analyses
- Data mining
- Data integration, data modeling, data management
The right solution for all functions
With Bissantz, business applications can be created for every department or functional area – quickly, easily, and in a standardized way. Whether in financial reporting, sales controlling, or personnel management – we make Business Intelligence as simple as it should be.
Visual design standards
Wherever you look, you see right. To perceive data, clear principles are needed that respect the limitations of human perception. Seeing and understanding data correctly and acting accordingly is not an art, but the result of this insight.
Innovation guarantee
Graphical tables, semantic zoom, typographically scaled numbers, haptic reasoning and much more: our research is the foundation on which we build to improve our products for our customers every day. We promise you will benefit from this.
Would you like to find out more about BARC reviews? Our FAQs answer the most important questions.
Bissantz DeltaMaster BARC Review & Rating
This section contains our independent analyst views on Bissantz DeltaMaster.
Provider and product description
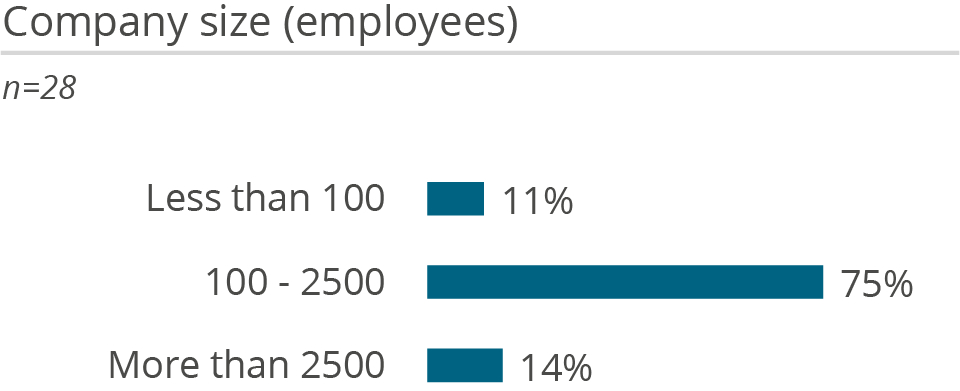
Bissantz & Company (Bissantz) is a medium-sized software vendor founded in 1996 and headquartered in Nuremberg, Germany. The company specializes in business intelligence (BI), analytics and planning solutions for enterprise data analysis and performance management. Bissantz employs over 100 people across offices in Germany and Switzerland, with a customer base of more than 500 organizations, primarily in Germany, Austria and Switzerland. Global consulting and support are provided through certified partners.
Bissantz’s flagship product, DeltaMaster, is an integrated platform for reporting, analysis and planning. Designed for mid-sized and large enterprises across industries, DeltaMaster supports business users in monitoring, analyzing and optimizing business performance. The platform includes tools for data integration, multidimensional data modeling and relational data processing through components such as DeltaMaster ETL and Application Designer. Prebuilt technical and business frameworks, referred to as ‘Solutions’, further accelerate deployment for specific use cases. DeltaMaster can integrate data from various on-premises and cloud sources to integrate it into a solid foundation. Most relevant sources include common ERPs, CRM systems, Microsoft SQL Server, Microsoft Azure, SAP HANA, Snowflake, Amazon, Google, Oracle, etc.
DeltaMaster’s strength lies in its robust analytical functionality, offering both predefined methods and automated analysis workflows. Its visualization capabilities emphasize clarity and actionable insights, with features such as graphical tables, dashboards and data-dense cockpits. Dashboards can be created by combining multiple reports into a unified view, while predefined templates and tools like ‘Magic Buttons’ and the analytic library simplify report creation. Advanced analytics methods, including statistical and predictive techniques, are also supported, enabling users to handle large data volumes effectively.
DeltaMaster provides flexible options for report creation, distribution and interaction. Reports can be static or dynamic and are accessible through various formats, including PDF, Excel, PowerPoint and web-based interfaces. Delivery options include push (e.g., email distribution) and pull (e.g., repository access) mechanisms. The platform supports both online and offline usage, catering to diverse business requirements. Classical OLAP functions, such as drill-down, slice-and-dice and roll-up, are available for multidimensional data, with similar capabilities extended to relational databases. Analyses generally start from a pivot table (known as a ‘graphical table’) or a wide range of predefined analytical methods. The DeltaApp enables intuitive data navigation on mobile devices offering operations via dragging, swiping and scrolling. Customers using Microsoft Power BI can apply Bissantz’s innovative data visualization best practices as custom visualizations (e.g., based on DeltaMaster data) or access Power BI data sets with DeltaMaster for further processing (e.g., advanced analytics or planning).
DeltaMaster integrates planning with reporting and analysis, enabling seamless workflows for top-down and bottom-up planning scenarios. Custom planning applications are based on relational data models and can be built using customer-specific data models or adapted from Bissantz’s prebuilt solutions (e.g., Integrated Planning). Prebuilt planning solutions include models, planning logic and workflows. Plan values are immediately available for forecasting, simulations and what-if analyses, and they can be directly incorporated into dashboards and reports for comparison with actuals. Workflow features support collaborative planning processes, with status tracking available within DeltaMaster dashboards.
Strengths and challenges of Bissantz DeltaMaster
BARC’s viewpoint on the product’s strengths and challenges.
Strengths
- Integrated product for analysis, reporting, dashboards and planning, available both on premises and in the Microsoft Azure cloud.
- Extensive set of intelligent analysis functions for handling large data volumes (including statistical and advanced analytics methods) and clear concepts for quickly understanding and acting on information.
- Innovative chart types for data-dense reports and dashboards including comprehensive options to implement visual design standards.
- Highly customizable platform for building individual planning applications, supporting both top-down and bottom-up planning scenarios, workflows and advanced commenting capabilities. Prebuilt but adaptable planning solutions are available.
Challenges
- Rather dogmatic product with its own concepts and approaches for the consumption and analysis of data (e.g., red and blue are the only two colors available in the solution).
- While flexibility in creating tailored planning applications is a strength, the platform offers limited prefabricated solutions. Many implementations are customized according to individual requirements. Bissantz’s future strategy strongly focuses on enhancing its planning capabilities, including “solutionizing” the platform to provide use case best practices and to speed up implementation projects.
- No Excel add-in with write-back functionality for planning data. The platform supports only data export to and import from Excel, which may limit adoption for organizations reliant on Excel-centric workflows.
- Compared to other midmarket-focused competitors, Bissantz tends to be in the upper price range. However, the cloud version of DeltaMaster provides a cost-effective alternative with lower upfront investment and faster time to value.
Bissantz DeltaMaster User Reviews & Experiences
The information contained in this section is based on user feedback and actual experience with Bissantz DeltaMaster.
The information and figures are largely drawn from BARC’s The BI & Analytics Survey, The Planning Survey, The Financial Consolidation Survey and The Data Management Survey. You can find out more about these surveys by clicking on the relevant links.
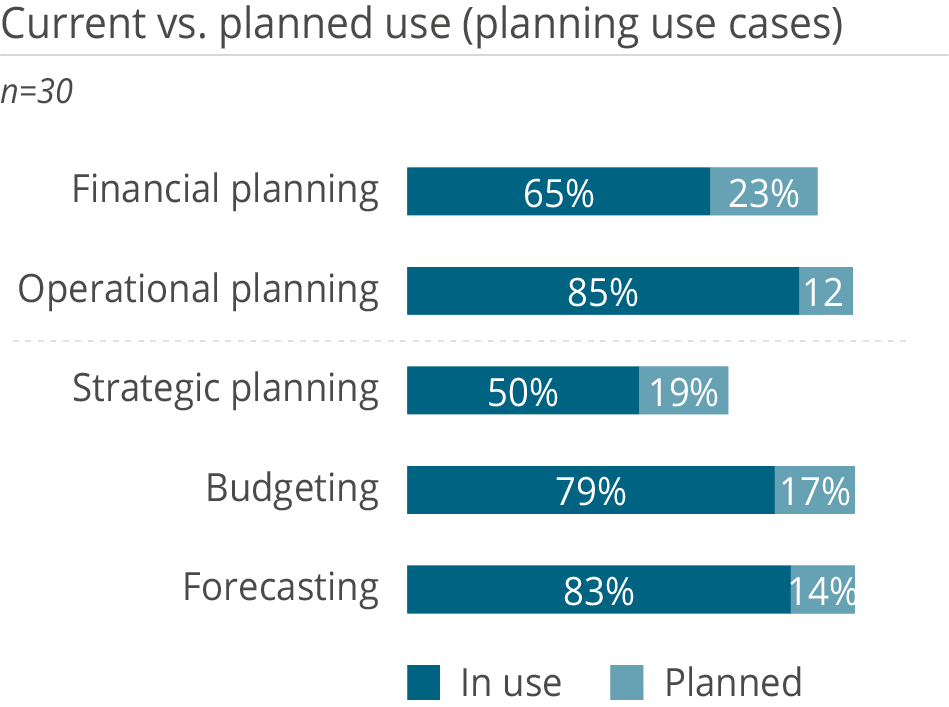
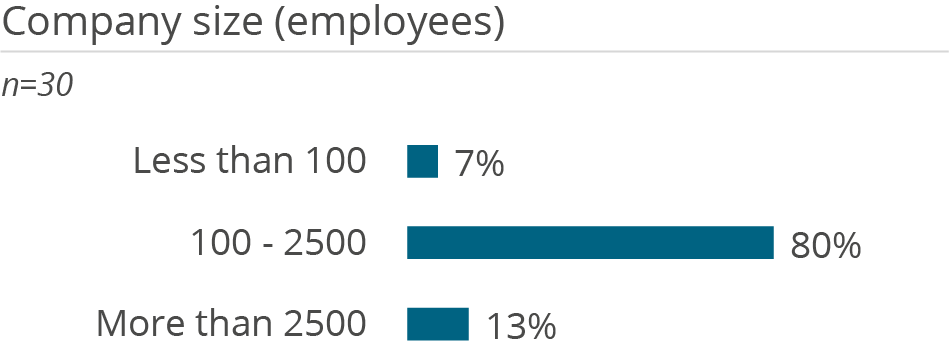
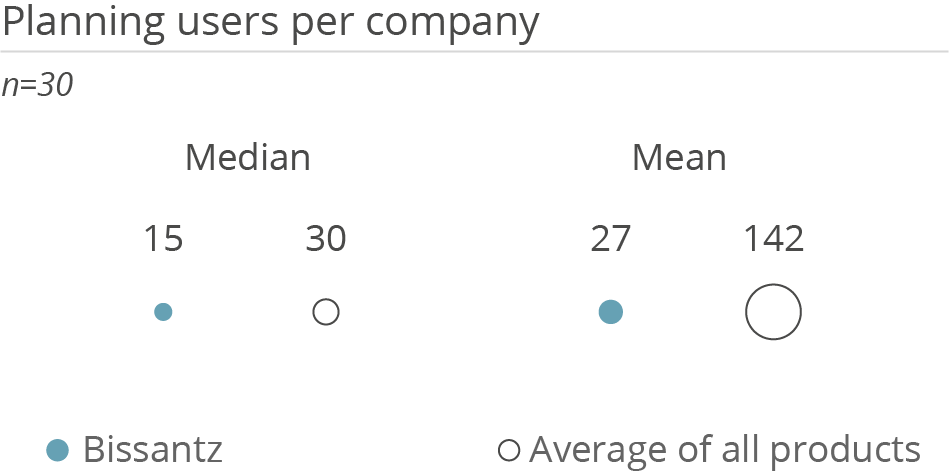
Who uses Bissantz DeltaMaster in a planning context and how
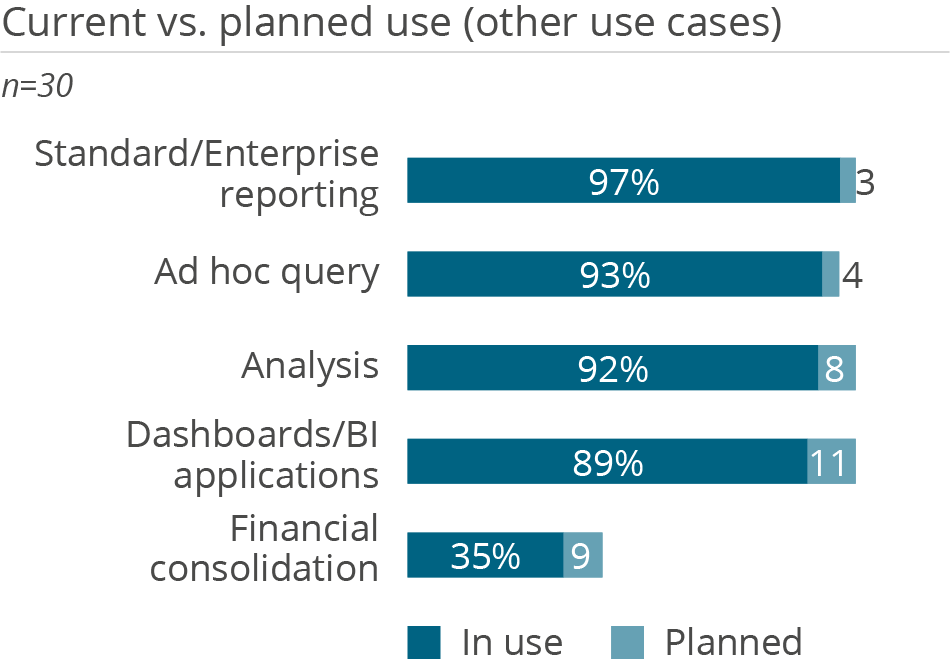
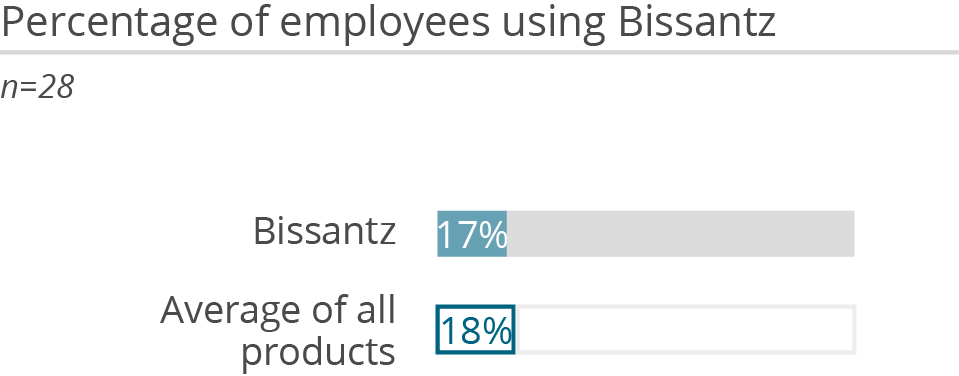
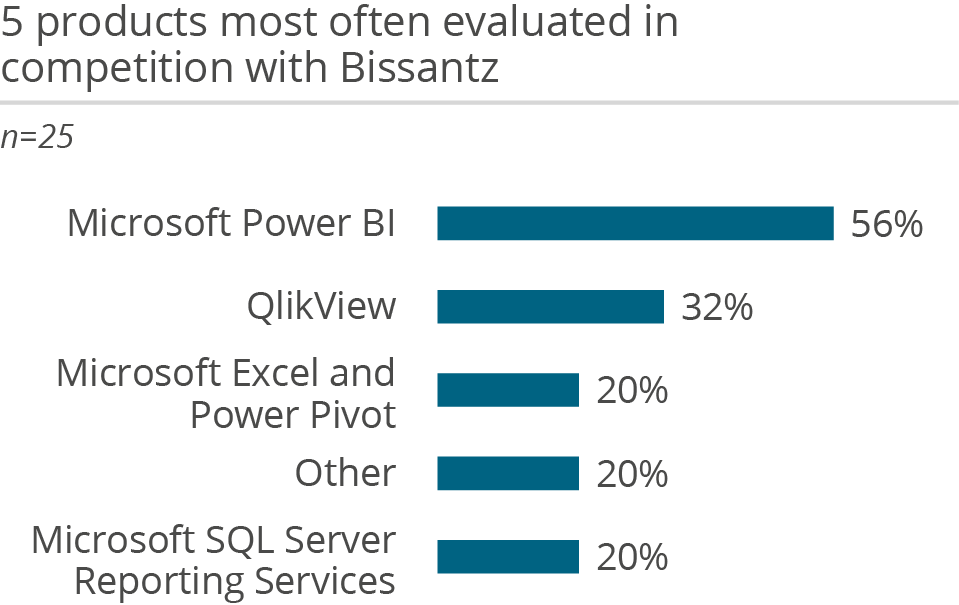
Who uses Bissantz DeltaMaster in a BI & analytics context and how
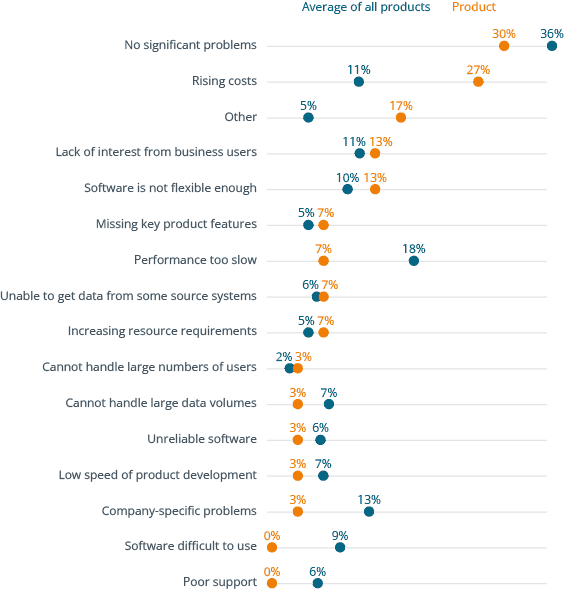
Why users buy Bissantz DeltaMaster and what problems they have using it
- Get independent information on software solutions, market developments and trends in data, analytics, business intelligence, data science and corporate performance management.
- Make data & analytics decisions based on numbers, data, facts and expert knowledge
- Access to all premium articles and all our research, including all software comparison studies, scores and surveys.
- Unlimited access to the BARC media library
- Consume unlimited content anywhere
Full user reviews and KPI results for Bissantz DeltaMaster
All key figures for Bissantz DeltaMaster at a glance.
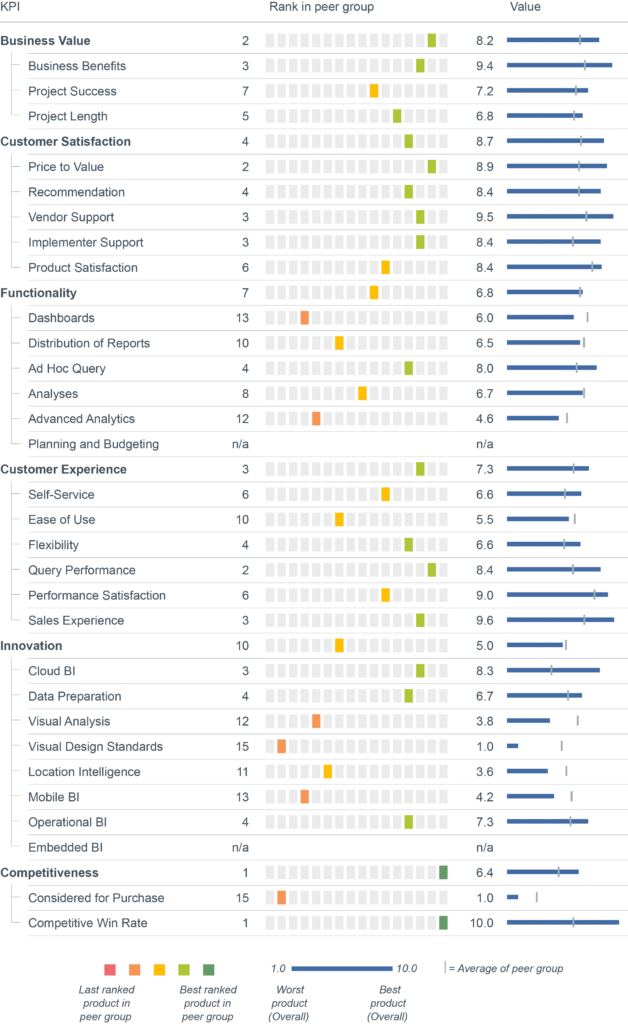
- Get independent information on software solutions, market developments and trends in data, analytics, business intelligence, data science and corporate performance management.
- Make data & analytics decisions based on numbers, data, facts and expert knowledge
- Access to all premium articles and all our research, including all software comparison studies, scores and surveys.
- Unlimited access to the BARC media library
- Consume unlimited content anywhere
Individual user reviews for Bissantz DeltaMaster
Number of employees
Industry
Source
What do you like best?
Variabilität im Bereich des Filterns und Navigierens; Exportfunktionen.
What do you like least/what could be improved?
Berechtigungsstruktur – extrem flexibel, aber Definitionen im Repository werden nicht automatisch auf die Anwendungen vererbt und müssen zusätzlich nachgearbeitet werden; grafische Funktionen bleiben unbefriedigend.
What key advice would you give to other companies looking to introduce/use the product?
Weniger ist mehr – besser auf einige Informationen verzichten, als mit übergroßem Ziel die Komplexität für Programmierer und Anwender unendlich zu erhöhen. Eigene Strukturen und Bedarfe vorher genau analysieren: Wer sind wir, was brauchen wir, was haben wir und was davon kann weg?
How would you sum up your experience?
Durchhaltevermögen und Konsequenz zur Schaffung der internen Akzeptanz müssen von ganz oben gelebt werden!
Number of employees
Industry
Source
What do you like best?
Konsequente, gute Visualisierung, Umsetzung hirngerechter Darstellung, super Support, gute Übersichtlichkeit, viele vorgefertigte Funktionen.
What do you like least/what could be improved?
Preis.
What key advice would you give to other companies looking to introduce/use the product?
Prototyp machen, klein starten, lernen, dann mehr machen.
How would you sum up your experience?
Exzellent.
Number of employees
Industry
Source
What do you like best?
Gute Sichtbarkeit und Aufbereitung der Daten, guter Export nach Excel.
What do you like least/what could be improved?
Neue Berichte bzw. Änderungen dauern teilweise sehr lange.
What key advice would you give to other companies looking to introduce/use the product?
Genaue Kenntnis der Datenherkunft und eine sinnvolle Schnittstellenstrategie.
How would you sum up your experience?
DeltaMaster lieferte sehr schnell nach Beginn des Projekts schon interpretierbare Daten. Die Bedienung ist intuitiv und die Aufbereitungsmöglichkeiten sind sehr gut.
Number of employees
Industry
Source
What do you like best?
Berichte sind schnell erzeugt in sehr ansprechendem Design, sofern keine spezifische Formatierung benötigt wird. Kennzahlen lassen sich bis zu einem gewissen Grad komfortabel in der Anwendung erzeugen.
What do you like least/what could be improved?
Abweichungen vom Standardlayout sind nicht vorgesehen, mehr Optionen an dieser Stelle wären wünschenswert. Die Abbildung komplexerer Kennzahlen muss in der zugrunde liegenden Datenbank erfolgen.
What key advice would you give to other companies looking to introduce/use the product?
Klare Definition der erwarteten Funktionen und Kennzahlen mitbringen und im Detail abstimmen, welche Aspekte sich im Frontend (einfach) und welche auf dem zugrunde liegenden Server (komplizierter) abbilden lassen.
How would you sum up your experience?
Positiv: Software mit klarem Konzept und klaren Strukturen, dazu gute Begleitung in Form von Workshops und Schulungen durch Bissantz.
Number of employees
Industry
Source
What do you like best?
Klare, fundierte Visualisierungsregeln. Integration in Services, Webclient, Publisher, Einbindung in Office, Mobile BI.
What do you like least/what could be improved?
Suchfunktionen für große Datenmodelle.
What key advice would you give to other companies looking to introduce/use the product?
Obwohl der DeltaMaster sehr skalierbar ist und Rollen vom Berichtsempfänger bis zum Data Scientist anspricht, benötigt man doch IT-affine Kollegen. Dies ist eigentlich eine systemunabhängige Beschreibung für Mitarbeitende in Controllingabteilungen, muss aber in Zeiten von Fachkräftemangel erwähnt werden.
How would you sum up your experience?
Wir sind Anbieter einer Data Warehouse basierten Branchenlösung für Krankenhäuser, der DeltaMaster ist ein wichtiger Baustein zur Informationsversorgung.
Number of employees
Industry
Source
What do you like best?
Durchgängige Visualisierung.
What do you like least/what could be improved?
Beschränkungen bzw. wenig Möglichkeiten bei der Visualisierung.
What key advice would you give to other companies looking to introduce/use the product?
Testen, ob es das geeignete Produkt ist.
How would you sum up your experience?
Sehr gute Zusammenarbeit. Super Unterstützung bei der Implementierung und danach.
Number of employees
Industry
Source
What do you like best?
Das schlichte Design und die Konzentration auf das Wesentliche.
What do you like least/what could be improved?
Etwas mehr Flexibilität/Möglichkeiten wären wünschenswert.
What key advice would you give to other companies looking to introduce/use the product?
–
How would you sum up your experience?
Grundsätzlich gut.
Number of employees
Industry
Source
What do you like best?
Planung sowohl auf detaillierter Ebene als auch pauschal möglich, mit vielfältigen Schlüsselungsmöglichkeiten.
What do you like least/what could be improved?
Für Nutzer, die nur einmal im Jahr planen, ist es nicht intuitiv genug.
What key advice would you give to other companies looking to introduce/use the product?
Tun Sie es.
How would you sum up your experience?
Langjährige gute Zusammenarbeit.
Number of employees
Industry
Source
What do you like best?
Konzept der Datenvisualisierung und Anpassbarkeit der eigenen Anwendung.
What do you like least/what could be improved?
Kontinuität des Lizenzmodells.
What key advice would you give to other companies looking to introduce/use the product?
Expertensystem - Anwender mit IT-Affinität von Vorteil.
How would you sum up your experience?
Rundum zufrieden.
Number of employees
Industry
Source
What do you like best?
Das Leistungsversprechen von DeltaMaster wird eingehalten („Mit 3-4 Klicks zur Ursache“). Einheitliches Standardreporting und ein zentraler Einstieg für Management sowie Fachabteilungen. Frühzeitige Erkennung und Kommunikation von Abweichungen. Übergreifende Abbildung entlang der Wertschöpfungskette.
What do you like least/what could be improved?
-
What key advice would you give to other companies looking to introduce/use the product?
Prüfung der Stammdaten im ERP-System vor der Einführung.
How would you sum up your experience?
Das Leistungsversprechen von Bissantz wurde eingehalten und bietet eine Plattform, um Daten aus unterschiedlichen Quellen (ERP-System, Marktdaten, etc.) sowie verschiedene Fragestellungen entlang der Wertschöpfungskette sinnvoll auszuwerten.
Number of employees
Industry
Source
What do you like best?
Die Grafischen Tabellen sind stark. Es ist sehr einfach, grundlegende Berichte zu bauen. Durch die Möglichkeit, alle Tabellen durch MDX aufzuwerten, bieten sich aber viele Möglichkeiten für Fortgeschrittene Nutzer. Der Berichtsversand über den Publisher und die Ausgabe in vorbereiteten Powerpoint und PDF-Vorlagen wird viel genutzt, könnte aber noch weiter ausgebaut werden (z.B. mehrere Reports auf eine Seite, Kombinationen).
What do you like least/what could be improved?
Schlechte Dashboardmöglichkeiten: Die Multiples bleiben weit hinter den Berichtsdesignmöglichkeiten anderer Anbieter zurück. Das gleiche gilt für die Kombination von Reports auf mehreren PDF/Exportseiten. So stark die grafischen Tabellen sind, ich möchte nicht 100% alles mit ihnen abbilden. Alles, was nicht grafische Tabelle ist, ist aber deutlich schlechter im Deltamaster. Die Kommentierungsfunktion könnte ausgebaut werden. Die Zellkommentare werden von uns viel genutzt und haben den Wert, den Deltamaster für uns im Controlling bietet, bestimmt um 50% erhöht.
What key advice would you give to other companies looking to introduce/use the product?
Bissantz Deltamaster hat sehr starke Vorstellungen davon, wie ihre Software und BI im Unternehmen zu nutzen und Berichte zu designen sind. Der Fokus ist dabei stark auf das Controlling ausgerichtet. Für Flexibilität in der Darstellung stehe ich regelmäßig auf verlorenem Posten und gerade außerhalb des Controllings hat die Anwendung bei uns wenige Freunde. Es lohnt sich aber definitiv nach Möglichkeiten zu gucken, wo SQL und MDX integriert werden können, da sich dadurch eine hohe automatisierte Dynamik sämtlicher Berichte erreichen lässt. Eine starke Funktion sind die Zellkommentare.
How would you sum up your experience?
Wie Apple: Bissantz weiß was du brauchst. Häufig haben sie Recht. In den Fällen, in denen du mehr grafische Freiheit brauchst, hast du keine Chance. Insgesamt für das Controlling mit vielen Berichtsbauern gut geeignet. Für Dashboards und Darstellungen in anderen Fachbereichen ist das Tool zu tabellenlastig
Number of employees
Industry
Source
What do you like best?
Visualisierung und Flexibilität.
What do you like least/what could be improved?
Ladezeit beim Start der Anwendung.
What key advice would you give to other companies looking to introduce/use the product?
Die Datenqualität der Ausgangssysteme kennen und verbessern.
How would you sum up your experience?
Das Tool hat uns weiter gebracht.
Number of employees
Industry
Source
What do you like best?
Toller Service, Innovation, Stringenz, Reduced to the Max.
What do you like least/what could be improved?
Preismodell für kleinere Unternehmen.
What key advice would you give to other companies looking to introduce/use the product?
Gute Vorbereitung, einfach starten.
How would you sum up your experience?
Exzellent.
Number of employees
Industry
Source
What do you like best?
Vorgefertigte Modelle.
What do you like least/what could be improved?
Für Fachabteilungsanwender Self-Service BI schwierig.
What key advice would you give to other companies looking to introduce/use the product?
Anwendungen bei Kunden anschauen, direkte Implementierung durch Hersteller.
How would you sum up your experience?
Sehr gut, auch wegen Support vom Hersteller direkt.
Number of employees
Industry
Source
What do you like best?
Schnelle zuverlässige Datenanalyse, Ablage von Standardberichten mit einfacher Aktualisierung.
What do you like least/what could be improved?
Wenig Flexibilität bei dem Berichtsdesign.
What key advice would you give to other companies looking to introduce/use the product?
Einsatz des Tools zur Datenanalyse, Standardberichtswesen nach IBCS in PowerBI.
How would you sum up your experience?
Gute Erfahrung. Kompetente Projektmanager. Man muss sich nur auf die Ideen des Gründers einlassen.
Number of employees
Industry
Source
What do you like best?
Graphische Darstellungsmöglichkeiten, ad-hoc Auswertungen.
What do you like least/what could be improved?
-
What key advice would you give to other companies looking to introduce/use the product?
Datenmodelle / Anwendungsfälle Schritt für Schritt entwickeln und umsetzten.
How would you sum up your experience?
Überaus professionell, wird auch nach ERP-Systemwechsel weiter verwendet, weil so universell.
Number of employees
Industry
Source
What do you like best?
Klares Design, durchdachte Reporterstellung, Automatisierung.
What do you like least/what could be improved?
Registerkarten anstatt 1-Fenster-Modus.
What key advice would you give to other companies looking to introduce/use the product?
Genaue Untersuchung der Quelldaten-Beziehungen und des gewünschten Datenmodells vor der Modellierung.
How would you sum up your experience?
Ausgezeichnet!
Number of employees
Industry
Source
What do you like best?
Klare GUI, definiertes Color Coding.
What do you like least/what could be improved?
Wenige Funktionen.
What key advice would you give to other companies looking to introduce/use the product?
Saubere Datenintegrationsumgebung aufbauen.
How would you sum up your experience?
Gutes Tool, sehr guter Support.
Number of employees
Industry
Source
What do you like best?
Klare und einfache Visualisierung.
What do you like least/what could be improved?
Flexibilität beim Design der Berichte.
What key advice would you give to other companies looking to introduce/use the product?
Genau klären, welche Kennzahlen im Frontend (performant) berechnet werden können und welche in SQL/anderweitig ermittelt werden müssen.
How would you sum up your experience?
Insgesamt gut.
Number of employees
Industry
Source
What do you like best?
Flexibilität bei der Einbindung von Daten.
What do you like least/what could be improved?
-
What key advice would you give to other companies looking to introduce/use the product?
Abhängig von der Art der erhobenen Daten und Aufbau des Berichtswesen muss eine gute und langfristige Projektplanung erfolgen.
How would you sum up your experience?
Sehr zufrieden, Darstellung unserer Datenstruktur aus vielen verschiedenen Primärsystemen ist möglich.
Number of employees
Industry
Source
What do you like best?
Schneller Zugriff auf Kundendaten / Umsätze.
What do you like least/what could be improved?
Eingriffe als Anwender unmöglich.
What key advice would you give to other companies looking to introduce/use the product?
Für Verkauf ein optimales Tool.
How would you sum up your experience?
Gut und sehr gutes Personal bei Problemen (schnelle Lösungsfindung).
Number of employees
Industry
Source
What do you like best?
Flexibiliät.
What do you like least/what could be improved?
Publisher ist recht umständlich und komplex. Und langsam. Bessere Visualisierung wäre hilfreich.
What key advice would you give to other companies looking to introduce/use the product?
Datenmodellierung gut planen.
How would you sum up your experience?
Sehr gut.
Number of employees
Industry
Source
What do you like best?
Das Visualisierungskonzept nach klaren Regel. (Tufte, Few, Hichert Erkenntnisse versus buntem Wildwuchs).
What do you like least/what could be improved?
Ad-hoc Usability könne durch Suchfunktionen für das Datenmodell verbessert werden.
What key advice would you give to other companies looking to introduce/use the product?
Key-User Berichtsersteller sollten Fachanwender sein. Diese werden schnell Fan der Software. Laien ohne große IT-Affinität kommen schnell an ihre Grenzen.
How would you sum up your experience?
Produktliebhaber.
Number of employees
Industry
Source
What do you like best?
Gute Möglichkeiten zur Berichterstellung.
What do you like least/what could be improved?
Geschwindigkeit, Flexibilität beim Layout von Berichten.
What key advice would you give to other companies looking to introduce/use the product?
Ziel und Zweck definieren. Zeit und Aufwand für Implementierung sowie Betrieb berücksichtigen.
How would you sum up your experience?
Meine wenigen Erfahrungen: gut!
Number of employees
Industry
Source
What do you like best?
Es wird relativ übersichtlich gehalten und erschlägt nicht mit Einstellungsmöglichkeiten.
What do you like least/what could be improved?
Wenn ich in einem Bericht nach einer Firma filtere und dann den Bericht wechsel, dann springt der Filter wieder auf die Ursprungsfirma. Es wäre cool, wenn das System die ausgewählte Firma beim Berichtswechsel behalten würde. Mein Kollege und ich habe jeweils eine RPT Lizenz und teilen uns eine Analyse Lizenz. Tatsächlich blocken wir uns oftmals gegenseitig, obwohl jeder eine eigene Reporting Lizenz hat.
What key advice would you give to other companies looking to introduce/use the product?
Wie viele unterschiedliche Data Marts / Cubes brauche ich im Unternehmen wirklich. Wie viele sind sinnvoll und was wäre die optimale Struktur.
How would you sum up your experience?
Für mich hat Bissantz Deltamaster einen ausgezeichneten Support. Unser Ansprechpartner weiß immer was er tut und hat auch Lust dem Anwender (mir) die Umgebung zu erläutern. Wenn ich eine neue Anforderung habe, die von Bissantz umgesetzt wird, entwickelt er nicht nur für sich am Rechner, sondern man macht es gemeinsam und bekommt immer eine Erläuterung zu den Zusammenhängen und was gemacht werden muss. Man hat das Gefühl, dass mein sehr gut aufgehoben ist!
Number of employees
Industry
Source
What do you like best?
Einfach alles.
What do you like least/what could be improved?
Einfach genau so weitermachen.
What key advice would you give to other companies looking to introduce/use the product?
Weniger Wasserkopfen, schneller einsetzen und dann anpassen und optimieren.
How would you sum up your experience?
So geht BI inkl. Planung. Alles in einem.
Number of employees
Industry
Source
What do you like best?
Innovation Konzept.
What do you like least/what could be improved?
Homogenität der Preismodelle, hier gibt es zu oft Änderungen.
What key advice would you give to other companies looking to introduce/use the product?
Qualifiziertes Personal.
How would you sum up your experience?
Es macht Spaß.
Number of employees
Industry
Source
What do you like best?
Die Analysemöglichkeiten und die Darstellung der Daten sind gut. Laufgeschwindigkeit auch. Vergleiche lassen sich gut darstellen und die Drilldown-Funktion ermöglicht eine flüssige Arbeitsweise. Guter Datenexport, um Nicht-User informiert zu halten, gute Publisher Funktion.
What do you like least/what could be improved?
Zur Planung ist das Tool in einem schnelllebigen Markt und bei vielen Artikeln und Kunden nicht geeignet, da nur mühsam höhere Planungsebenen eingezogen werden können. Plant man auf diesen, werden die Daten in die untergeordneten Ebenen hineingeschrieben und ergeben keinen Sinn mehr. Die Erfassung der Planung auf einer höheren Planungsebene ist mühsam. Das Splashing funktioniert zwar, ist aber sinnlos bei kurzen Produktlebenszyklen.
What key advice would you give to other companies looking to introduce/use the product?
Weniger ist mehr. Was interessiert am meisten, was sind die wichtigen Merkmale/Merkmalskombinationen, nach denen die Analysen stattfinden können müssen. Es sollten intern und dann mit dem Implementierer Workshops zur Selbstfindung stattfinden, v.a. dann, wenn bislang jeder für sich seine Auswertung gemacht hat.
How would you sum up your experience?
Im täglichen Reporting und für Analysen ein gutes Tool. Als Planungstool weniger geeignet. Stabil in der Performance.
Number of employees
Industry
Source
What do you like best?
Klares strukturiertes Berichtsdesign. Spiel der Farben. Einfachheit mit Drag und Drop.
What do you like least/what could be improved?
Alle Daten aus dem Vorsystem sollten hereingeladen werden können ohne Aufpreis.
What key advice would you give to other companies looking to introduce/use the product?
Tolle Software jedoch teuer.
How would you sum up your experience?
Eine sehr gute Software, die etwas flexibler sein könnte und leider etwas teuer ist.
Number of employees
Industry
Source
What do you like best?
Die schnelle und umfängliche Erstellung von Analysen.
What do you like least/what could be improved?
Die Entwicklungs- und Admin-Tools.
What key advice would you give to other companies looking to introduce/use the product?
Überarbeiten und modernisieren Sie die Tools (Publisher, Repositoryverwaltung, DeltaMaster Bearbeitungsmodus).
How would you sum up your experience?
Es ist erstaunlich, wie schnell komplexe Analysen mit sehr guter Navigation zusammengeklickt werden können.
Number of employees
Industry
Source
What do you like best?
Klare Strukturen und Anpassbarkeit der Lösungen.
What do you like least/what could be improved?
Keine individuellen Favoriten in den Berichten speicherbar. Keine modernen Grafiken.
What key advice would you give to other companies looking to introduce/use the product?
Vorher Klarheit in Prozesse und Strukturen definieren. Spätere Anpassungen sind möglich aber manchmal aufwändig.
How would you sum up your experience?
Hervorragendes Tool zur Planung, Analyse und Reporting!
Number of employees
Industry
Source
What do you like best?
Hohe Bedienungsfreundlichkeit bei extremer Flexibilität für zeiteffektive Abweichungsanalysen.
What do you like least/what could be improved?
Wir sind hoch zufrieden
What key advice would you give to other companies looking to introduce/use the product?
Einfach mit der Fa. Bissantz einen Termin ausmachen, ein paar eigene Daten zur Verfügung stellen und dann nur noch staunen, was die eigenen Daten für Stories über das Unternehmen erzählen können.
How would you sum up your experience?
Einfach nur genial!
Number of employees
Industry
Source
What do you like best?
Einfache, klar strukturierte Oberfläche.
What do you like least/what could be improved?
Im Bereich Planung fehlen für uns kleine, aber spezielle Funktionen.
What key advice would you give to other companies looking to introduce/use the product?
–
How would you sum up your experience?
Sehr gute Erfahrung mit dem Hersteller und mit dem Implementierungspartner. Die Mitarbeiter kommen gut damit zurecht und haben ein leistungsfähiges Werkzeug.
Number of employees
Industry
Source
What do you like best?
Vorgefertigte statistische Modelle.
What do you like least/what could be improved?
Erläuterungen und Erklärungen von Abfragemodellen.
What key advice would you give to other companies looking to introduce/use the product?
Vorher Anwender besuchen.
How would you sum up your experience?
Sehr gut.
Number of employees
Industry
Source
What do you like best?
Geschwindigkeit für Anpassungen von Anwendungen, Einfachheit der Anwendung, Darstellung der Ergebnisse
What do you like least/what could be improved?
–
What key advice would you give to other companies looking to introduce/use the product?
Vorbeikommen und selber in unserer Life-Anwendung erleben
How would you sum up your experience?
Seit Start sehr gut, erste Demo, die hält, was sie verspricht.
Number of employees
Industry
Source
What do you like best?
Das Visualisierungskonzept mit klar handlungsmotivierender Aufmerksamkeitssteuerung.
What do you like least/what could be improved?
–
What key advice would you give to other companies looking to introduce/use the product?
Entwicklung eines Prototyps mit Bissantz. Der Prototyp wird nach eigener Erfahrung sehr schnell durch Bissantz bereitgestellt - und nichts bereitet einen späteren Proof-of-Concept besser vor als ein Prototyp basierend auf den im Unternehmen vorhandenen Daten.
How would you sum up your experience?
Bissantz überzeugt bereits bei der Einführung mit einer hervorragenden Consultingleistung und mit einem auch für die höchste Management-Ebene überzeugendem Visualisierungskonzept und gutem Self-BI.
Number of employees
Industry
Source
What do you like best?
Schlüssiges und klares Farbsignalkonzept (Berichtswetter), Sparklines-Grafiken, automatisierte Berichtsverteilung GUI: Trennung zwischen Anwendung und Administration
What do you like least/what could be improved?
–
What key advice would you give to other companies looking to introduce/use the product?
Stammdatenpflege!
How would you sum up your experience?
Enormer Zugewinn an Transparenz.
Number of employees
Industry
Source
What do you like best?
Die Möglichkeit auf verschiedenen Aggregationsebenen zu planen.
What do you like least/what could be improved?
Insgesamt ist der DeltaMaster zu restriktiv in seinen Möglichkeiten.
What key advice would you give to other companies looking to introduce/use the product?
Erst testen, dann kaufen. Die Use-Cases von Bissantz sind extrem vereinfacht. So sieht die Unternehmensrealität nicht aus.
How would you sum up your experience?
Insgesamt tut der DeltaMaster, was er soll. Aber es ist Luft nach oben. Keine integrierte Planung.
