About The Planning Survey
The most extensive business planning survey globally. Learn what 1,200 users think about planning products and uncover the latest trends that matter for your business planning today.
The Planning Survey 25 is the eleventh edition of BARC’s annual report on the planning software market. Our research is primarily based on a sample of 1,187 survey responses from software users and consultants around the world, providing detailed user feedback on 19 of the leading planning, budgeting and forecasting software solutions on the market.
Our user survey covers issues ranging from the selection and purchase of software through to deployment and use, including questions about the success of planning software projects, the usability of each product and problems encountered.
The following links provide more detail on our survey methodology, the survey sample and the way in which we categorize and rate planning products:
Respondents
Countries
Planning Products
Years
Components of The Planning Survey
The findings from The Planning Survey 25 are published across several bite-size documents (see below). These documents do not need to be read in sequence. The Results and the Vendor Performance Summaries can be read independently.
BARC also provides the raw data via a web-based tool – The Planning Survey Analyzer – enabling users to carry out their own analysis of the survey results.
The Results
An overview and analysis of the most important product-related findings and topical results from The Planning Survey 25.
The Analyzer
Our powerful interactive online tool, enabling you to perform your own custom analysis of the full survey data set.
Vendor Performance Summary
A series of executive reports on each product featured in The Planning Survey 25. Each report contains a vendor and product overview by BARC’s analyst team plus all the relevant product-related results from The Planning Survey.
Sample & Methodology
Much of the value of The Planning Survey 25 lies in its large, well-distributed and unbiased sample of survey responses. This section describes the characteristics of the people who took part in the study.
The Planning Survey 25 has the largest sample of any survey of planning, budgeting and forecasting software users available on the market. As far as possible, we only draw conclusions from sub-samples containing at least 20 data points.
Our data cleansing rules are thorough and involve a number of different tests. All fraudulent or suspect data that purports to be from genuine planning software users is removed.
Sample size and make-up
Many thousands of people around the world were invited to take part in The Planning Survey 25, using dozens of email lists, magazines and websites.
A summary of the online data collected is shown in the table, with the total number of responses removed also displayed.
The number of responses is divided between users, consultants and vendors. As in previous years, vendors answered a different set of questions to those answered by users (and consultants answering on behalf of users).
| Responses removed from the samples | Responses |
|---|---|
| Total responses | 1,187 |
| Removed during data cleansing | -113 |
| Total answering questions | 1,074 |
| Total responses analyzed | Responses |
|---|---|
| Users | 844 |
| Consultants | 112 |
| All users | 956 |
| Vendors/Resellers | 77 |
| Non-users | 41 |
Organization sizes by headcount
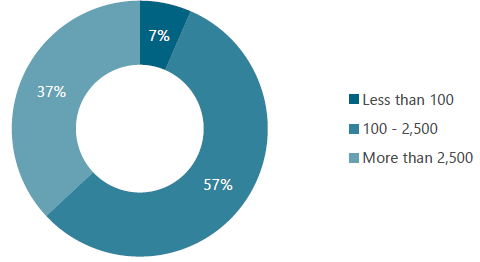
Planning, budgeting and forecasting products are mostly found in large organizations, a fact reflected in the high percentage of responses we received from users in companies with more than 2,500 employees.
However, the level of responses from small organizations has been catching up over the years.
The split between respondents from small and large enterprises is well balanced this year.

Vertical markets
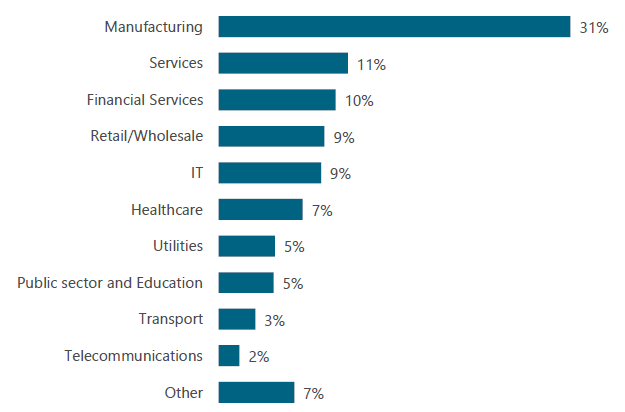
The chart on the right shows the breakdown of survey responses by industry sector. It only includes respondents who answered product-related questions in the survey (i.e., users and consultants).
Manufacturing comes out on top – as it has in previous years – with 31% of the sample.

Planning Products in The Planning Survey
We require at least 28 user reviews for the survey results of any planning product to be analyzed in detail. 19 planning, budgeting and forecasting tools reached this threshold in this year’s Planning Survey.
When grouping and describing the planning solutions featured in The Planning Survey, we do not always follow the naming conventions the vendors use to the letter. The names we use are sometimes abbreviated and are not always the official product names used by the vendors at the time of publication.
We asked respondents explicitly about their experiences with products from a predefined list, with the option to nominate other products. This list is updated each year and is based on the sample size of the products in the previous year, as well including new entrants to the planning market.
Where respondents said they were using an ‘other’ product, but from the context it was clear that they were actually using one of the listed products, we reclassified their data accordingly.
The table to the right shows the planning products included in our detailed analysis.
| Product name | Respondents |
|---|---|
| Anaplan | 29 |
| Bissantz | 30 |
| Board | 43 |
| CCH Tagetik | 30 |
| CoPlanner | 34 |
| evidanza | 30 |
| IBM Planning Analytics | 73 |
| Jedox | 52 |
| LucaNet | 35 |
| macs Software | 29 |
| OneStream | 28 |
| Oracle Cloud EPM | 28 |
| Planful | 31 |
| Prophix | 43 |
| SAP Analytics Cloud | 35 |
| SAP BPC | 28 |
| Unit4 FP&A | 31 |
| Vena | 32 |
| Workday Adaptive Planning | 56 |
The Peer Groups
A range of different planning and budgeting tools is featured in The Planning Survey 25, so we use peer groups to help identify competing products. This approach ensures we make fair and useful comparisons of planning tools that are likely to compete, for the benefit of readers and vendors alike.
The segmentation of the peer groups is based on three key factors:
- Focus – Is the product focused on and typically used for planning, budgeting and forecasting (e.g., finance, sales & operations, HR, etc.), financial consolidation or business intelligence and analytics?
- Usage scenario – Is the product typically used in midsize/departmental implementations or large/enterprise-wide implementations?
- Geographical presence – Does the vendor have a global reach and offer its products worldwide?
Peer groups serve as a guide to the reader to help make the products easier to understand and to show why individual products return such disparate results. They are not intended to be a judgment of the quality of the products. Most products appear in more than one peer group.
Besides planning and performance management, BI and analytics-focused products also target use cases such as reporting, dashboarding, (ad hoc) analysis and advanced analytics.
Designed for planning, budgeting and forecasting, these products cater to various sub-plans (financial, operational, strategic), offering flexibility and predefined planning solutions for specific applications. Since The Planning Survey is focused on exactly this use case, this peer group includes all the products featured in the survey.
- Anaplan
- Bissantz
- Board
- CCH Tagetik
- CoPlanner
- evidanza
- IBM Planning Analytics
- Jedox
- LucaNet
- macs Software
- OneStream
- Oracle Cloud EPM
- Planful
- Prophix
- SAP Analytics Cloud
- SAP BPC
- Unit4 FP&A
- Vena
- Workday Adaptive Planning
With a strong emphasis on financial performance management, these products provide built-in financial intelligence and predefined business rules for an integrated approach to (financial) planning and financial consolidation.
- Board
- CCH Tagetik
- CoPlanner
- Jedox
- LucaNet
- OneStream
- Oracle Cloud EPM
- Planful
- Prophix
- SAP BPC
- Unit4 FP&A
- Vena
Beyond planning and performance management, these products integrate comprehensive reporting, dashboarding, ad hoc query and analysis capabilities, expanding their scope beyond pure planning functionality.
- Bissantz
- Board
- evidanza
- IBM Planning Analytics
- Jedox
- SAP Analytics Cloud
- Vena
- Workday Adaptive Planning
Products in this peer group are typically (but not exclusively) used in smaller and midsize scenarios and/or departmental implementations with a moderate number of users.
- Bissantz
- CoPlanner
- evidanza
- Jedox
- LucaNet
- macs Software
- Planful
- Prophix
- Unit4 FP&A
- Vena
- Workday Adpative Planning
Products in this peer group are typically (but not exclusively) used in large scenarios and/or enterprise-wide implementations with many users.
- Anaplan
- Board
- CCH Tagetik
- IBM Planning Analytics
- OneStream
- Oracle Cloud EPM
- SAP Analytics Cloud
- SAP BPC
These vendors have a truly global sales and marketing reach. They are present worldwide, and their products are used all around the world.
- Anaplan
- Board
- CCH Tagetik
- IBM Planning Analytics
- Jedox
- LucaNet
- OneStream
- Oracle Cloud EPM
- Prophix
- SAP Analytics Cloud
- SAP BPC
- Unit4 FP&A
- Workday Adaptive Planning
The KPIs
The KPIs are designed to help the reader spot winners and losers in The Planning Survey 25 using well-designed dashboards packed with concise information. There is a set of 27 normalized KPIs (which we refer to as ‘root’ KPIs) for each of the 19 products, as well as 6 aggregated KPIs based on aggregations of various combinations of ‘root’ KPIs.
A set of KPIs has been calculated for each of the six peer groups. The values are normalized according to the whole sample.
The KPIs all follow these simple rules:
- Only measures that have a clear good/bad trend are used as the basis for KPIs.
- KPIs may be based on one or more measures from The Planning Survey.
- Only products with samples of at least 15 – 30 (depending on the KPI) for each of the questions that feeds into the KPI are included.
- For quantitative data, KPIs are converted to a scale of 1 to 10 (worst to best).
- A linear min-max transformation is applied, which preserves the order of, and the relative distance between, products‘ scores.
- In some instances, adjustments are made to account for extreme outliers.
KPIs are only calculated if the samples have at least 15 – 30 data points (this varies depending on the KPI) and if the KPI in question is applicable to a product. Therefore some products do not have a full set of root KPIs.
Our methodology document describes all the KPIs and calculation methods in detail. See our methodology PDF.
| Aggregated KPIs | Root KPIs |
|---|---|
| Business Value |
Business Benefits Project Success Project Length |
| Competitiveness |
Considered for Purchase Competitive Win Rate |
| Customer Satisfaction |
Product Satisfaction Vendor Support Implementer Support Price to Value Recommendation Sales Experience |
| Functionality |
Predefined Connectors Data Integration Planning Content Planning Functionality Workflow Forecasting Simulation Reporting/Analysis Financial Consolidation |
| User Experience |
Self-Service Ease of Use Flexibility Performance Satisfaction |
| Innovation |
Cloud Planning Driver-Based Planning Predictive Planning |