Microsoft, the world’s largest software company, was founded in 1975 and has become a household name primarily due to its Windows operating system and Office suite. With its offerings, Microsoft wants to contribute to a modern workspace for its customers, whether they are private individuals or large enterprises. The vendor has a broad enterprise offering, ranging from cloud infrastructure (Azure) to database to its ERP products.
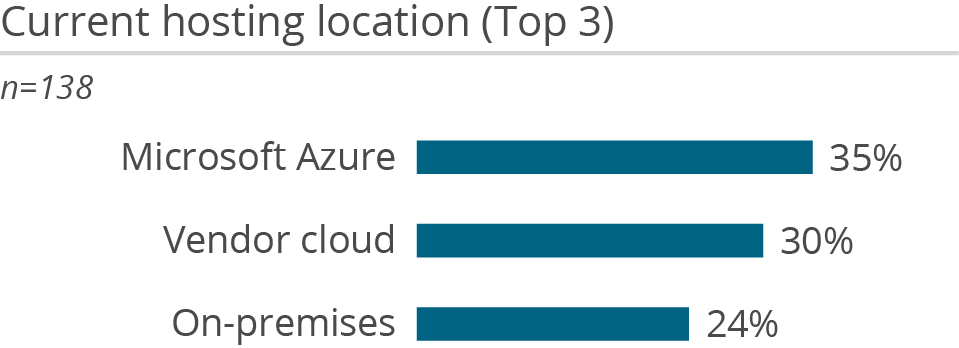
Microsoft was among the first vendors to focus on providing cloud-based solutions for analytics, a path later followed by several competitors. Azure is used by numerous companies as a cloud computing platform and for storing substantial amounts of data, putting Microsoft in a good position to offer integrated analytics front ends. Indeed, the vendor has not only integrated Power BI, its core BI & analytics platform, with many Azure Services and Microsoft products but has also included it in various product packages.
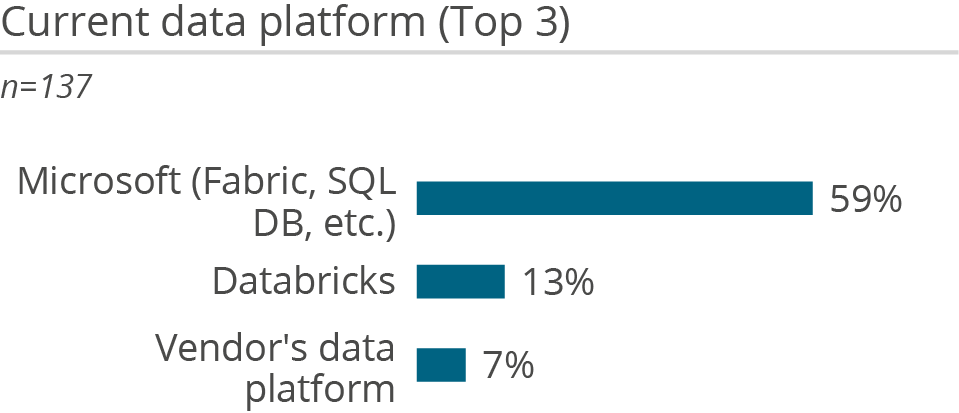
Microsoft Fabric, designed as an integrated end-to-end data & analytics platform delivered as software as a service (SaaS) and generally available since late 2023, is the latest addition. The package contains several Azure services such as Power BI, Azure Synapse Analytics, Azure Data Factory and many more. The core value proposition and advantage for customers is that the already stitched together services facilitate the building up of a SaaS environment consisting of data & analytics services. Another additional benefit is the obligatory data lake ‘OneLake’, which is automatically connected with all other Fabric services and can be used by customers without extra configuration.
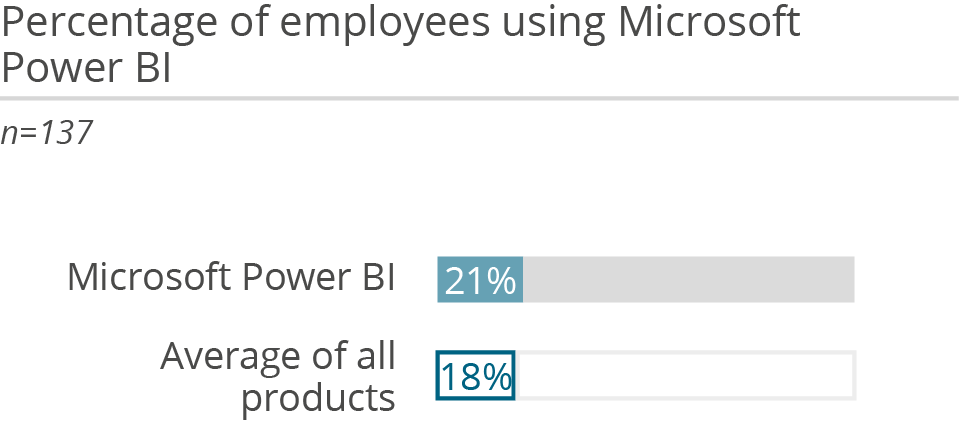
Power BI itself is a cloud-based analytics product consisting of Power BI Desktop (a full client for data preparation, dashboards and analysis) and Power BI Service (a web application primarily for content publishing and sharing with limited content creation capabilities). It is an interactive tool for data visualization geared at enabling business users to analyze data and share insights, predominantly via dashboards. Furthermore, there is a native mobile app (Android, iOs) for accessing content on the go.
Data visualization in Power BI delivers rich visualizations but is limited in flexibility by its dashboard-oriented approach. NLQ makes it easy for users to retrieve relevant visualizations. Guided analytics is mostly covered by ‘Quick Insights’, a feature that automatically analyzes data sets for patterns and outliers and provides the user with suggestions about relevant findings. The ‘Insight’ feature can be used to receive information about interesting patterns in the data a specific visualization is based on. For advanced requirements, AutoML features are integrated into Power BI dataflows.
At the end of 2023, Microsoft introduced its AI-based service Copilot for Power BI. The product is designed to support business users as well as report users with capabilities such as the creation of dashboards and visuals, report page summaries and answering questions about the data in the underlying model as well as writing DAX queries. Copilot is continuously being extended with some features still in public preview.
Microsoft has also incorporated formatted reporting functionality into Power BI: Power BI Report Builder allows users to create Paginated Reports which can then be shared in the Power BI Service. Furthermore, for on-premises customers, Power BI Report Server delivers a subset of Power BI features, mostly to facilitate their migration to the cloud.
Power BI content can also be integrated into Microsoft PowerPoint to provide better data storytelling capabilities as well as to increase the use of insights gained in Power BI for a larger number of users.