Strategy_logo

What is Strategy One?

Integrated BI suite for reporting, analysis, dashboards with functions for mobile BI, operational BI and GenAI.

Customer Satisfaction
7.2
7.2/10
User Experience
7.8
7.8/10
Functionality
8.0
8.0/10
Business Value
6.9
6.9/10

About Strategy One

The information in this section has been provided by the vendor of Strategy One.

Self-description of the vendor

No vendor self-description available

Strategy One screenshots

Strategy One videos

Downloads

About BARC Reviews

Would you like to find out more about BARC reviews? Our FAQs answer the most important questions.

References
No data available
Partners
No data available

Case studies from this vendor

BARC studies, events and webinars with this vendor

Strategy One BARC Review & Rating

This section contains our independent analyst views on Strategy One.

Provider and product description

Founded in 1989 as MicroStrategy and rebranded to Strategy in February 2025, Strategy is one of the best-known vendors in the BI & analytics market worldwide. As part of the rebranding, Strategy incorporated the Bitcoin symbol into its logo and describes itself as “the world’s first and largest Bitcoin Treasury Company, and the largest independent, publicly traded business intelligence company”. From a product perspective, in 2003, Strategy first released its fully integrated platform providing formatted reports, dashboards and interactive data discovery capabilities in a unified product using the same infrastructure and a consistent interface.

Strategy pursues the vision of providing “Intelligence Everywhere” by developing a solution that combines BI and AI to fulfill all customer needs and is capable of serving all types of users. Its flagship platform Strategy One is based on a tightly integrated architecture that was built from the ground up without acquisitions. It offers functionality for dashboards, reporting, AI and analysis and can be used to implement various use cases such as operational, embedded and mobile analytics. Together with its library of statistical and advanced analytics functions, the vendor offers comprehensive capabilities to fulfill additional analytics requirements.

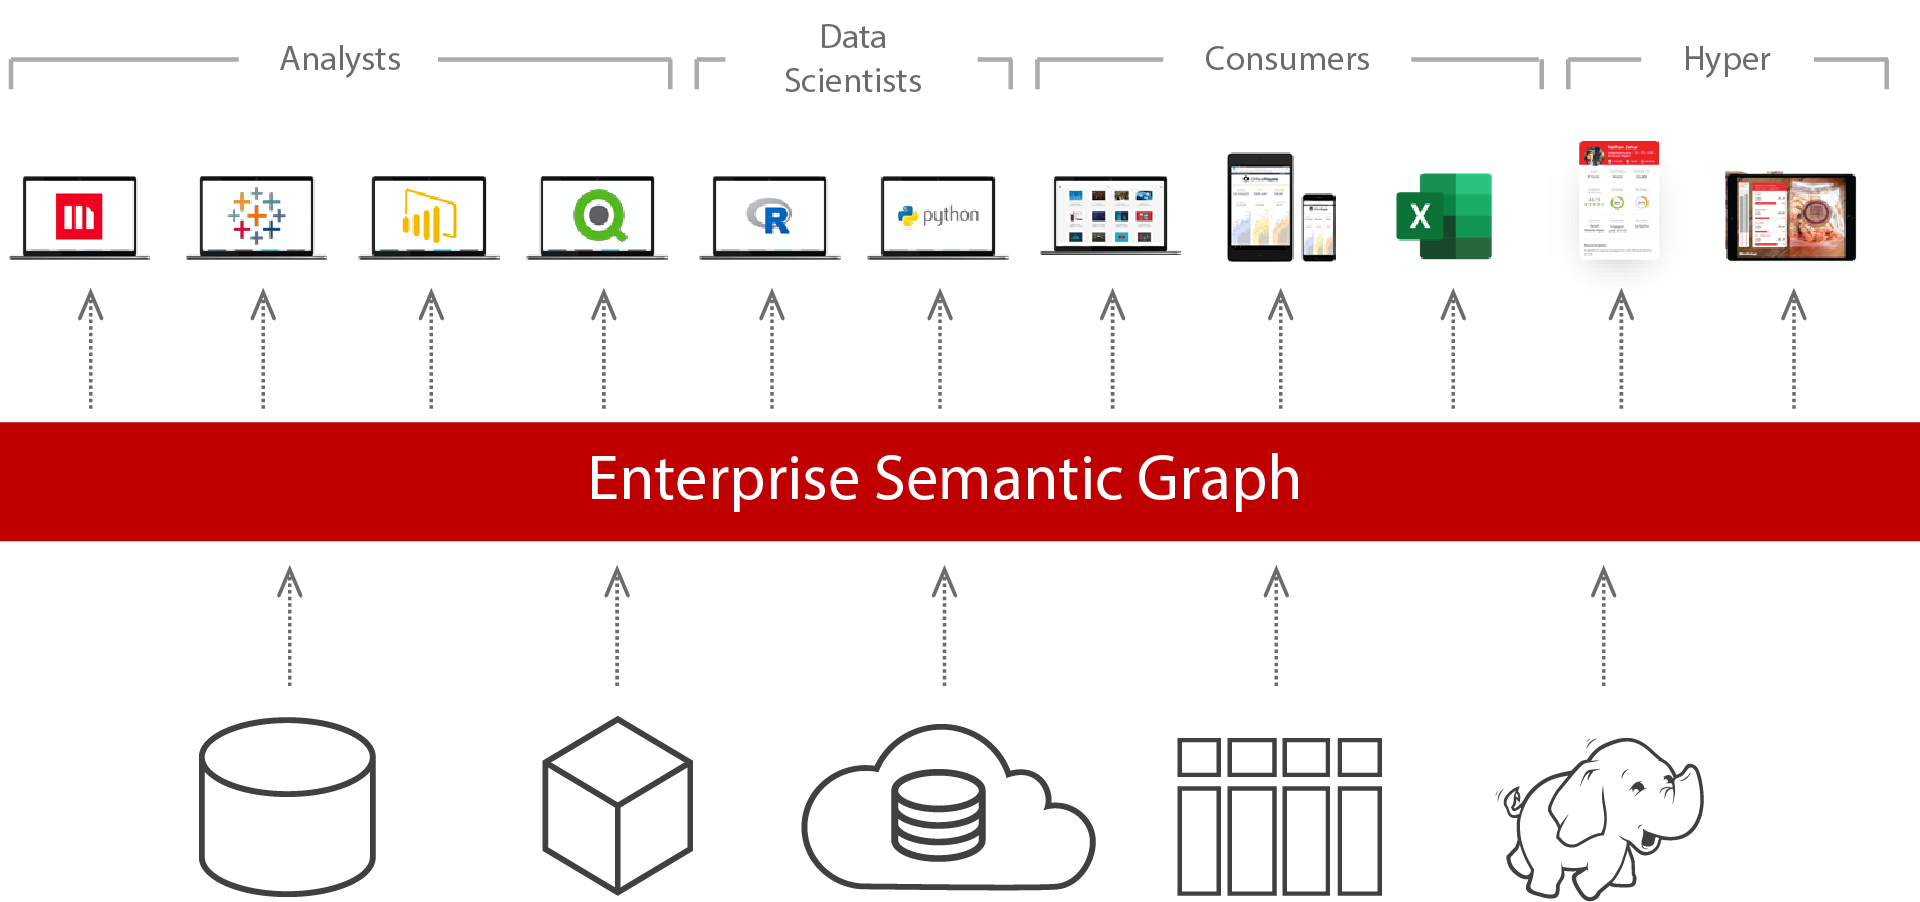
The suite offers various clients, which connect to an enterprise Semantic Graph (semantic layer) to deliver common and governed business logic across multiple data sources with strong calculation and caching features. Business users can use the enterprise Semantic Graph, typically created by technically savvy users, or create their own data models (data sets). For additional governance, data sets can be combined with the enterprise Semantic Graph or certified. Strategy has adopted an open approach by allowing third-party tools such as Tableau, Qlik, Power BI, Jupyter and RStudio to access its Semantic Graph. Recently, the vendor started to offer the Semantic Graph technology as a standalone product called Mosaic.

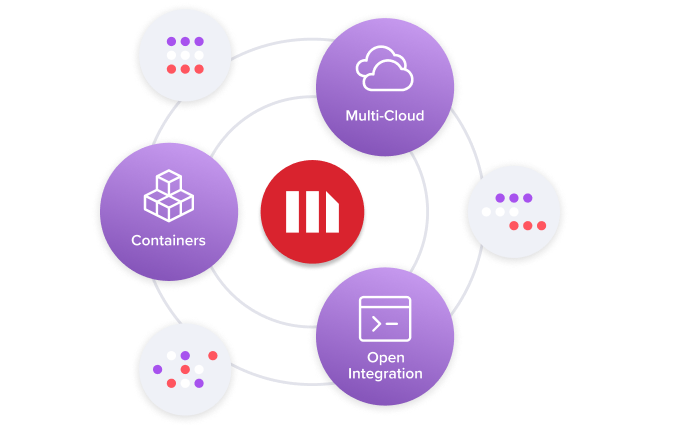
Strategy offers 100+ connectors to data sources, as well as native support for cloud databases and data lakes. Besides direct connectivity to source systems, the product has an integrated in-memory engine to ensure fast query performance on large data sets. Strategy has a cloud-native containerized microservices architecture. It supports multi-cloud scenarios and can be deployed in managed or customer-owned clouds with support for common hyperscalers (AWS, Azure, GCP) and more recently STACKIT.

Strategy has always taken market trends seriously. The vendor provides a no-code development framework to build native mobile apps. Offline capabilities and write-back data entry for transactions and operational use cases are available too. The vendor offers a modern dashboard interface to analyze, present and visualize data. Dashboards are interactive applications that organize visualizations or reports in a familiar book-oriented chapter-and-page format giving them a logical flow.

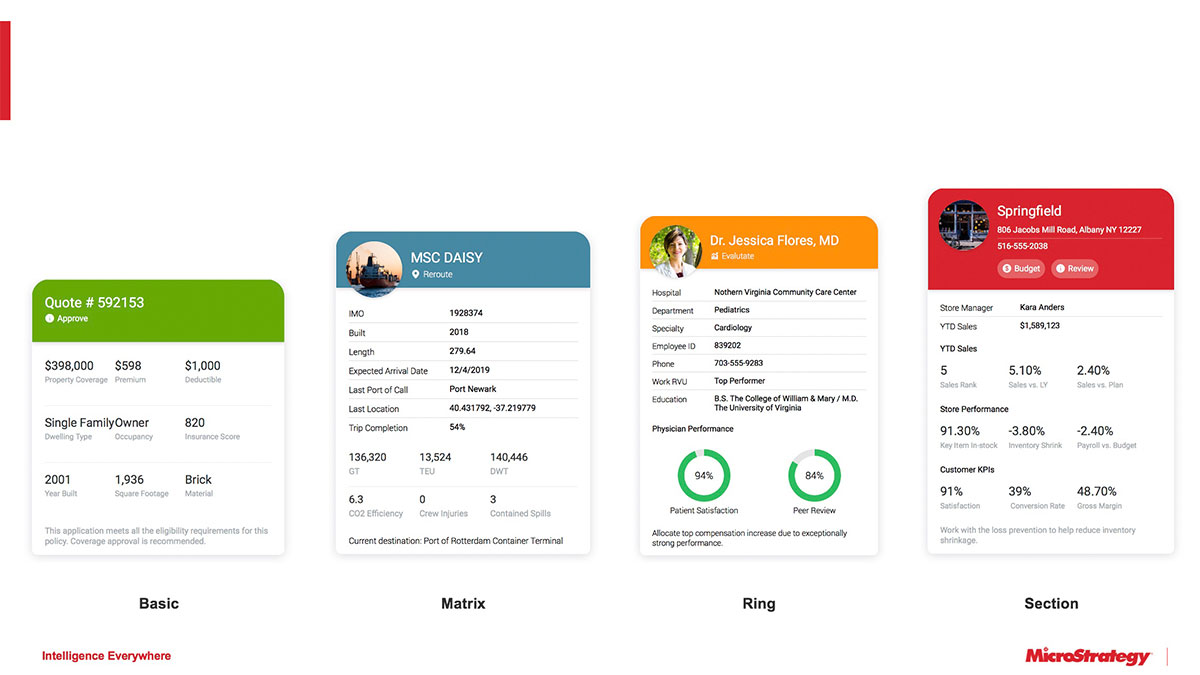
To extend the adoption of analytics by business users, Strategy provides ‘HyperIntelligence’, now also integrated with Auto, Strategy’s AI Agent for answering user questions, to surface contextual information to users directly in web applications, on mobile devices and in selected productivity applications with zero clicks. This allows businesses to inject real-time, contextual insights and recommendations with respective actions into users’ browser-based or mobile workflows or their work within office applications – bringing analytics closer to their work. Embedding analytics in business applications, in cooperation with service providers and often targeting distinct industries, continues to provide a great opportunity for vendors to further differentiate their offering from the competition.

In the area of AI, Strategy also offers various helpful features. The AI offering, running under the previously mentioned ‘Auto’ umbrella, includes ‘Auto SQL’, ‘Auto Data Modeling’, ‘Auto Dashboard’ and ‘Auto Answers’, which are targeted at different user types to support them in their daily work. ‘Auto Bot’ enables customers to create, customize and deploy their own chatbots. ‘Auto’ uses multiple interpretation layers and benefits from the strong Semantic Graph and LLMs. These bots can be deployed on their own, on mobile, embedded into any application and from HyperCards. With the latter, it is therefore possible to provide HyperIntelligence users with AI-based features.

Strengths and challenges of Strategy One

BARC’s viewpoint on the product’s strengths and challenges.

Strengths
  • Single integrated platform for formatted reports, dashboards, analysis and analytics application building with good performance in large environments.
  • Connectivity and connectors for third-party analytics tools such as Tableau, Qlik and Power BI grant access to its Semantic Graph.
  • Strategy takes important and relevant trends seriously and mostly develops solid strategies and tools to address them. With ‘Auto Expert’, its own resources and learning materials have their own dedicated AI powered tool, which is fully integrated into Strategy’s platform.
  • The ‘Auto’ AI tool leverages Strategy’s Semantic Graph to ensure data security and integrity. With capabilities catering for different user types, ‘Auto’ allows them to ask questions in natural language and receive instant answers while also providing advanced analytics functionalities, for instance, to generate forecasts.
  • HyperIntelligence, primarily aimed at embedding data & analytics directly into operational workflows, enables users to access contextual information with zero clicks across existing applications, productivity tools and devices with highly personalized information to all users. The recent integration with Auto enhances the experience using GenAI.
Challenges
  • Strategy, as one of the oldest and most respected BI vendors, made a significant leap with its bold rebranding in 2025, leaving behind a long-standing and well-known brand name. It will be interesting to see how the brand and its go-to market strategy as an independent vendor further evolve compared to rival market players.
  • With the announcement of the end-of-support cycle for Strategy legacy on-premises in January 2025, Strategy created some confusion within its customer community. Furthermore, it is yet to be verified whether Strategy’s cloud-first strategy and its promised advantages outweigh the lack of an on-premises offering.
  • Data models created by business users (data sets) cannot be automatically converted to the enterprise Semantic Graph (semantic layer) as the data modeling environments are not fully integrated. An impending release seeks to address this matter, but it was not available at the time of writing.
More results & reviews from Strategy One interested?

Get the full BARC score free from the provider

Need more help finding the right software?

Find out how our expertise can help you.

Strategy One User Reviews & Experiences

The information contained in this section is based on user feedback and actual experience with Strategy One.

The information and figures are largely drawn from BARC’s The BI & Analytics Survey, The Planning Survey, The Financial Consolidation Survey and The Data Management Survey. You can find out more about these surveys by clicking on the relevant links.

Who uses Strategy One in a BI & analytics context and how

Why users buy Strategy One and what problems they have using it

Premium content. Unlock with BARC+.
For just €79 per month (€948 per year) you can access all the paid content on www.barc.com.
Your benefits:

Full user reviews and KPI results for Strategy One

All key figures for Strategy One at a glance.

Premium content. Unlock with BARC+.
For just €79 per month (€948 per year) you can access all the paid content on www.barc.com.
Your benefits:

Individual user reviews for Strategy One

Role
Head of business department
Number of employees
100 - 2.500
Industry
Manufacturing
Source
BARC Panel, The BI & Analytics Survey 26, 03/2025
What do you like best?

Ad-hoc-Berichte sind schnell und einfach zu erstellen.

What do you like least/what could be improved?

Komplexere Berichterstellung ist ohne Berater nicht möglich.

What key advice would you give to other companies looking to introduce/use the product?

Das Datengerüst ist alles. Man muss sich vorher Gedanken darüber machen, welche Auswertungen man braucht; dann können alle Transformationen, Attribute und Metriken bereitgestellt werden.

How would you sum up your experience?

Ist hilfreich, aber nicht mein Lieblingstool.

Role
Employee of a cross-departmental BI/analytics team
Number of employees
More than 2.500
Industry
Banking and finance
Source
BARC Panel, The BI & Analytics Survey 26, 05/2025
What do you like best?

Capacité à un large déploiement de reporting basé sur une définition unique des KPI.

What do you like least/what could be improved?

Communication software brouillée par le fracas sur sa stratégie Bitcoin.

What key advice would you give to other companies looking to introduce/use the product?

Prendre le temps de fabriquer une couche sémantique simple et partagée.

How would you sum up your experience?

Bonne.

Role
Project manager for BI/analytics from business department
Number of employees
100 - 2.500
Industry
Retail
Source
BARC Panel, The BI & Analytics Survey 26, 05/2025
What do you like best?

Rapidité à traiter des volumes immenses de données. Facilité à mettre à disposition des données par des professionnels du BI à l'utilisateur/décisionnaire final. Ergonomie agréable pour l'utilisateur final.

What do you like least/what could be improved?

Le coût (même si je ne suis pas directement décisionnaire sur ce point).

What key advice would you give to other companies looking to introduce/use the product?

RAS.

How would you sum up your experience?

Très bonne opinion, capacité à traiter plutôt rapidement des volumes de données avec des millions ou centaines de millions de lignes.

Role
IT employee
Number of employees
More than 2.500
Industry
Utilities
Source
BARC Panel, The BI & Analytics Survey 26, 03/2025
What do you like best?

They have built it themselves and have not been purchased by any other company to be integrated into their product, nor have they been acquired by any other company.

What do you like least/what could be improved?

Complex licensing.

What key advice would you give to other companies looking to introduce/use the product?

Strategy offers various services to onboard their product and to ensure it is fully optimized afterwards, to make sure it is utilized.

How would you sum up your experience?

Extremely innovative company paving the way in AI and setting a very high standard for enterprise BI.

Role
Consultant
Number of employees
Less than 100
Industry
Retail
Source
BARC Panel, The BI & Analytics Survey 26, 05/2025
What do you like best?

Continuity in performance.

What do you like least/what could be improved?

Making local differences in operations.

What key advice would you give to other companies looking to introduce/use the product?

Test and review competitive options.

How would you sum up your experience?

Satisfactory.

Role
IT employee
Number of employees
More than 2.500
Industry
Insurance
Source
BARC Panel, The BI & Analytics Survey 26, 03/2025
What do you like best?

Governance, security, scalability, range of functional capabilities.

What do you like least/what could be improved?

Workstation and Library have features that Web and Developer don't, and vice versa. I think the sooner all features from Developer and Web are migrated to Workstation and Library, the better.

What key advice would you give to other companies looking to introduce/use the product?

Buy it! Strategy may not have the publicity that Looker, Tableau, and Power BI have because, potentially, they don't have the same marketing clout that Google, Salesforce, and Microsoft have. However, my view is that it is a far superior product, and its high degree of re-usable objects makes for more efficient support and delivery of changes in a highly governed environment that can't be matched by the likes of Looker, Tableau, and Power BI.

How would you sum up your experience?

Excellent platform. Having gotten the governance and security sorted years ago, they can now focus on delivering more and more front-end functionality.

Role
Head of a separate BI/analytics organization unit
Number of employees
More than 2.500
Industry
Banking and finance
Source
BARC Panel, The BI & Analytics Survey 26, 03/2025
What do you like best?

It's much more than a BI solution, with a strong governance layer and good look-and-feel. You have a lot of other tools: write-back capability, APIs, schedulers... We are building our CRM interface on Strategy.

What do you like least/what could be improved?

Not an easy platform. It is not easy to find qualified service.

What key advice would you give to other companies looking to introduce/use the product?

Good training helps to make full use of the capabilities.

How would you sum up your experience?

Great option for BI and more, very good response from the vendor.

Role
Project manager for BI/analytics from IT
Number of employees
More than 2.500
Industry
Retail
Source
BARC Panel, The BI & Analytics Survey 26, 03/2025
What do you like best?

Semantischer Layer sowie das flexible Rechte- und Rollenkonzept.

What do you like least/what could be improved?

Lizenzmodell bezüglich Subscriptions.

What key advice would you give to other companies looking to introduce/use the product?

Anwendungsfälle betrachten insbesondere bezüglich Rechtekonzept, Subscription und Embedding

How would you sum up your experience?

Viele Verbesserungen in den letzten Jahren. Nachholbedarf beim Subscriptionmanagement.

Role
IT employee
Number of employees
More than 2.500
Industry
Public sector
Source
BARC Panel, The BI & Analytics Survey 26, 03/2025
What do you like best?

Benutzerfreundlichkeit und intuitive erweiterte Funktionalitäten für BI-Nutzer.

What do you like least/what could be improved?

Die Möglichkeit, Cubes anzubieten, ist beschränkt und nicht leistungsfähig genug.

What key advice would you give to other companies looking to introduce/use the product?

Bei großen Datenmengen im Voraus prüfen, ob gute Antwortzeiten erreicht werden können.

How would you sum up your experience?

Gutes Konzept, jedoch gibt es diverse Herausforderungen in der Praxis

Role
Head of a separate BI/analytics organization unit
Number of employees
100 - 2.500
Industry
Manufacturing
Source
BARC Panel, The BI & Analytics Survey 26, 04/2025
What do you like best?

Ich finde immer eine Lösung für eine Aufgabe oder ein Problem, auch wenn sie nicht immer optimal ist.

What do you like least/what could be improved?

Das Design ist etwas in die Jahre gekommen. Es ist manchmal schwierig zu erkennen, wie genau das System die Rohdaten verarbeitet bzw. welche Auswirkungen eine Änderung an den Rohdaten hat!

What key advice would you give to other companies looking to introduce/use the product?

Fangen Sie klein an und achten Sie darauf, das Datenmodell nicht ausufern zu lassen!

How would you sum up your experience?

Man kann sich sehr flexibel bewegen, muss allerdings ständig daran arbeiten, den Überblick nicht zu verlieren!

Role
Employee of a cross-departmental BI/analytics team
Number of employees
More than 2.500
Industry
Banking and finance
Source
Invited by the vendor, The BI & Analytics Survey 25, 05/2024
What do you like best?

Trusted tool that we have had since 1997. Easy to produce reports and dashboards. Semantic model. One tool that can do everything.

What do you like least/what could be improved?

The connection between MicroStrategy and Teradata is the bottle neck. Few internal visualizations, need implementation of Vitara to get more and better graph types.

What key advice would you give to other companies looking to introduce/use the product?

Always upgrade and be on the latest version.

How would you sum up your experience?

It's a good platform that takes a little time to learn but after that it is easy to produce in and use for the end users.

Role
IT employee
Number of employees
More than 2.500
Industry
Insurance
Source
Invited by the vendor, The BI & Analytics Survey 25, 05/2024
What do you like best?

An amazing bit of kit with many on-point features that go beyond just basic reports and dashboards. MicroStrategy are constantly innovating with new, relevant features being released almost monthly. As an admin / architect, once familiar with the platform, it's straightforward to use with a quick delivery time. A competitive ROI. End users can knock up rich, functional dashboard with little to no training..

What do you like least/what could be improved?

It would be nice if there was a more friendly UI for dealing with APIs.

What key advice would you give to other companies looking to introduce/use the product?

Buy it! There are platforms out there that seem to get a lot more press (e.g. Power BI, Looker, Tableau), but if you want a proper enterprise grade BI platform that can do everything these do and more, then get MicroStrategy. The outstanding level of governance built into the platform through its extensive reusability of objects means you only ever need one architect to look after the platform; in other platforms, such as those mentioned above, you'll be forever chasing your tail, with duplicate objects all over the place. However, governance does not mean locked down: there is still ample capacity to allow users to build and share dashboards, metrics, filters, etc. In summary, the beauty of MicroStrategy is that while the likes of Tableau were appealing to individuals' aesthetic side, MicroStrategy were nailing the governance through their carefully constructed semantic layer. Now MicroStrategy can simply focus on adding more and more front-end functionality while other vendors have to re-think how their platforms have been built from the ground-up and how to implement anything like the sort of governance offered by MicroStrategy.

How would you sum up your experience?

Great platform. Continually surprises me with how to accomplish pretty much anything we want.

Role
IT employee
Number of employees
More than 2.500
Industry
Transportation and logistics
Source
Invited by the vendor, The BI & Analytics Survey 25, 05/2024
What do you like best?

Gute Wartbarkeit bei Anpassungen im semantischen Layer.

What do you like least/what could be improved?

Wenig automatisierte Dokumentation, teilweise lange Ladezeiten der Cubes, AI nur in Cloud-Lösung nutzbar, undurchsichtige und komplexe Lizensierung.

What key advice would you give to other companies looking to introduce/use the product?

Cloud-Lösung mit AI verwenden.

How would you sum up your experience?

Stabiles BI-Tool, schwierige Vermittlung der Nutzerverwaltung, Probleme handhabbar.

Role
Head of a separate BI/analytics organization unit
Number of employees
More than 2.500
Industry
Insurance
Source
BARC Panel, The BI & Analytics Survey 25, 04/2024
What do you like best?

Einfaches Handling, flexibe Einsatzmöglichkeiten, vollumfängliche Abdeckung unserer Compliance Anforderungen, flexibles auf uns zugeschnittenes Preismodell.

What do you like least/what could be improved?

Nichts im Moment

What key advice would you give to other companies looking to introduce/use the product?

Unbedingt kompetenten Migrations-/Implementierungspartner einbinden.

How would you sum up your experience?

Sehr gut.

Role
Consultant
Number of employees
More than 2.500
Industry
Manufacturing
Source
BARC Panel, The BI & Analytics Survey 25, 03/2024
What do you like best?

Das semantische Modell ist eine hervorragende Abstraktionsschicht zwischen dem Data Warehouse und den Fachanwenderinnen und -anwendern.

What do you like least/what could be improved?

Es gibt nach wie vor zwei Entwicklungsumgebungen (Desktop und Web), die auch noch zum Teil redundante aber leicht unterschiedlich implementierte Funktionen bereitstellen.

What key advice would you give to other companies looking to introduce/use the product?

Die semantische Modellierung sollte von cross-funktionalen Teams aus IT und Fachbereich umgesetzt werden. Power Userinnen und Power User sollten ausgiebig im Umgang mit dem semantischen Modell und dem Bau von Dossiers geschult werden.

How would you sum up your experience?

Ein sehr mächtiges Tool, das - richtig eingesetzt - viel Zeit und Ressourcen in den Fachbereichen sparen kann.

Role
IT employee
Number of employees
100 - 2.500
Industry
Banking and finance
Source
BARC Panel, The BI & Analytics Survey 25, 05/2024
What do you like best?

Sehr intergiertes Produkt, sehr gute Programmierschnittstellen(APIs), sehr stabil im Produktionseinsatz.

What do you like least/what could be improved?

Die Art und Weise wie Daten modelliert werden könnte. Die Art und Weise wie Metriken gebaut werden, ist für den Business User nicht einfach, der User muss mit Seiteneffekten rechnen, was auch an der Datenmodellierung liegt.

What key advice would you give to other companies looking to introduce/use the product?

Ich kann Microstrategy empfehlen für ein Standard Reporting, das alle Aspekte des Unternehmensreportings abdeckt. Das Potential der APIs und Cubes sollte dabei hervorgehoben werden. Für Data Science, wo wir es mit Advanced Usern zu tun haben, die Flexibilität benötigen, würde ich es nur einsetzen, wenn über APIs anderen Analysewerkzeugen zugänglich gemacht werden (REST-Python/R).

How would you sum up your experience?

-

Role
Head of a separate BI/analytics organization unit
Number of employees
100 - 2.500
Industry
Hospitality
Source
Invited by the vendor, The BI & Analytics Survey 25, 06/2024
What do you like best?

Ease of maintenance with the cloud platform. Ability to handle large data volumes. Delivers excellent performance in the load times of reports and dashboards. Excellent customer relationship management and support.

What do you like least/what could be improved?

Web/Library user interface should be improved. Lack of built-in visualizations. The development process can be time-consuming. Other tools can deliver visually more appealing dashboards.

What key advice would you give to other companies looking to introduce/use the product?

MicroStrategy being an enterprise analytics tool can be used with large volumes of data and still get good report performance. However, using this platform for daily self-service reporting with smaller datasets can be an overkill. With MicroStrategy you can standardize object definitions across all reporting within the organization, however, the development of reports and the preparation of datasets can be time-consuming. The platform provides excellent tools for development but finding skilled developers can be a challenge.

How would you sum up your experience?

Excellent platform for providing a single reporting solution for the whole organization no matter the scale of the company or their data and analytics needs.

Role
Employee of a cross-departmental BI/analytics team
Number of employees
More than 2.500
Industry
Retail
Source
Invited by the vendor, The BI & Analytics Survey 25, 05/2024
What do you like best?

Neue Entwicklungen wie AI. Zentrales Metadatarepository.

What do you like least/what could be improved?

-

What key advice would you give to other companies looking to introduce/use the product?

Bei Vergleichen zwischen Tools immer die Business Cases evaluieren. In der Evaluierung nur Fakten glauben. Rating auf Business Cases vornehmen (Erfüllt / nicht erfüllt). Dann Tool selektieren.

How would you sum up your experience?

Ausgezeichnetes Tool für Enterprise Reporting, aber auch für vieles andere.

Role
Project manager for BI/analytics from IT
Number of employees
More than 2.500
Industry
Retail
Source
BARC Panel, The BI & Analytics Survey 25, 05/2024
What do you like best?

Robust semantic layer and governance / security. Innovative products like Hyperintelligence.

What do you like least/what could be improved?

Learning curve for business users - especially power users - can be steep. Admin tools (especially Workstation) should be improved.

What key advice would you give to other companies looking to introduce/use the product?

Recommended product but prepare your data in the data warehouse (use views for flexibility) and make sure you map those out in the logical layer of MicroStrategy keeping solid conventions.

How would you sum up your experience?

We enjoy it, migrating to MicroStrategy Cloud platform made a very positive impact.

Role
Consultant
Number of employees
More than 2.500
Industry
Manufacturing
Source
BARC Panel, The BI & Analytics Survey 25, 05/2024
What do you like best?

Huge data volume handling. Easy implementation.

What do you like least/what could be improved?

UI. Visual graphics.

What key advice would you give to other companies looking to introduce/use the product?

Just go for it if budget is not a constrain.

How would you sum up your experience?

Exceptional tool

Survey Information
Number of reviews for Strategy One
24
Reviewed versions
Peer groups in the survey
Large/Enterprise-Wide Implementations, Report & Dashboard Focus, Analysis Focus, International BI Giants
Don‘t miss out!
Join over 25,775 data & analytics professionals and get the latest product insights, research, surveys and more!
Our newsletter is your source for the latest developments in data, analytics, and AI!