Pyramid Logo
Customer Satisfaction
8.4/10
8.4
User Experience
7.2/10
7.2
Functionality
8.5/10
8.5
Business Value
7.3/10
7.3

Pyramid Analytics

What is Pyramid Analytics?

Integrated, web-based BI platform for dashboards, reporting, analysis and advanced analytics.

BI, Analytics & CPM
●● Reporting / Dashboards
●● Analysis
●● Advanced Analytics
– Planning
– Financial Consolidation

= Function covered, ●● = Functional focus

= Function covered
●●
= Functional focus

About Pyramid Analytics

The information in this section has been provided by the vendor of Pyramid Analytics.

Self-description of the vendor

No vendor self-description available

Pyramid Analytics screenshots

Pyramid Analytics videos

References
No data available
Partners
No data available

Pyramid Analytics BARC Review & Rating

This section contains our independent analyst views on Pyramid Analytics.

Provider and product description

Founded in 2009, Pyramid Analytics is a privately held software company with more than 150 employees. The company is headquartered in the Netherlands and has offices in the United States, Israel and the United Kingdom. It continues to grow and now supports more than 1,000 customers.

Pyramid Analytics launched its first BI product, BI Office, back in 2012. In 2017, the company introduced Pyramid Decision Intelligence Platform (Pyramid), a newly architected and revamped product to help customers make faster and more intelligent business decisions by automating the decision-making process.

Pyramid combines components for data preparation, reporting, dashboards, machine learning and advanced analytics into a unified enterprise BI & analytics platform. It was designed from inception to bridge the gap between self-service and IT-driven BI & analytics, providing agility for decentralized business users while retaining centralized monitoring and control. This fosters enterprise-wide collaboration through the sharing of business logic and content.

The vendor puts an emphasis on Pyramid as an open and agnostic web-based platform. Its open architecture means the software can be deployed in different environments: cloud, hybrid or on premises. Moreover, Pyramid is device and operating system agnostic with full gesture support on touchscreen and mobile devices. Through this versatility, customers can use the product to transform their existing and traditional on-premises businesses to modern cloud-based deployments.

Pyramid also supports REST API to cater for scenarios such as embedding and automation. Its analytics engine, ‘PYRANA’, drives both querying and analytic calculations across different data sources using ANSI SQL or MDX – which enables fast in-place analytics on large data sets. This extends direct analysis to numerous relational, in-memory, cloud data warehouses and unstructured data sources natively – including Pyramid’s own proprietary in-memory engine. Pyramid also offers certified support to various SAP data sources, making it a viable alternative to leverage data from, for example, BW/4HANA without duplicating it. Data preparation and modeling features to support data integration and processing are incorporated into the product. Besides connecting and querying data, the vendor also supports write-back to selected relational data sources.

For ML and AI, the vendor relies on R, Python, MLib, Weka and TensorFlow integrations. Pyramid is also investing in GenAI and has incorporated AI into its data preparation and analytics front ends. Its NLQ chatbot now leverages LLMs to provide users with search-based analytics on all data sources without indexing all the data upfront. Moreover, automated insights (‘Smart Insights’) leverage NLG to explain basic facts, relationships, forecasts and other findings when applied to visuals or query results. Power users also benefit from incorporated AI features such as assistance for formulas or dashboard creation.

Recent improvements include the Tabulate and Solve modules. Tabulate is a browser-based spreadsheet environment which resembles Microsoft Excel. It offers business analysts well-known Excel formulas and granular formatting options. The module stores its objects, like other Pyramid objects, centrally and does not produce single file structures as its prominent competitor does. Solve is an optimization engine, incorporated into the Tabulate environment, which can be used for decision modeling and to solve optimization problems. The insights users gain in Tabulate can be published to other users using the Publish module.

Strengths and challenges of Pyramid Analytics

BARC’s viewpoint on the product’s strengths and challenges.

Strengths
  • Well-integrated platform for reporting, dashboards, data preparation and analysis – all in a single, enterprise-grade environment
  • Good connectivity with in-database analytics to various data sources including business applications such as SAP, leading to high performance perception by users
  • Open architecture and provision of APIs suitable for various analytics use cases beyond classic BI, such as embedding and analytics applications
  • Provision of enterprise platform features such as governance, security, lineage, impact analysis, versioning and content distribution for large-scale deployments
  • Well thought-out capabilities for dynamic text for storytelling, spreadsheet-like calculations and formatting as well as topics in the area of GenAI, and advanced and prescriptive analytics
Challenges
  • Visual data exploration for business users is not as intuitive as some competitors’ products (for instance, it follows a ‘visualization first’ principle and lacks visualization recommendations)
  • Feature-rich environment potentially overwhelms creators from business departments, curbing use and value of analytics despite the introduction of streamlined ‘Smart’ and ‘Light’ interfaces
  • Active guidance features offer basic help but lack functionality to assist business users, especially with data preparation (for instance, through join or transformation step recommendations)
Need more help finding the right software?

Find out how our expertise can help you.

Pyramid Analytics User Reviews & Experiences

The information contained in this section is based on user feedback and actual experience with Pyramid Analytics.

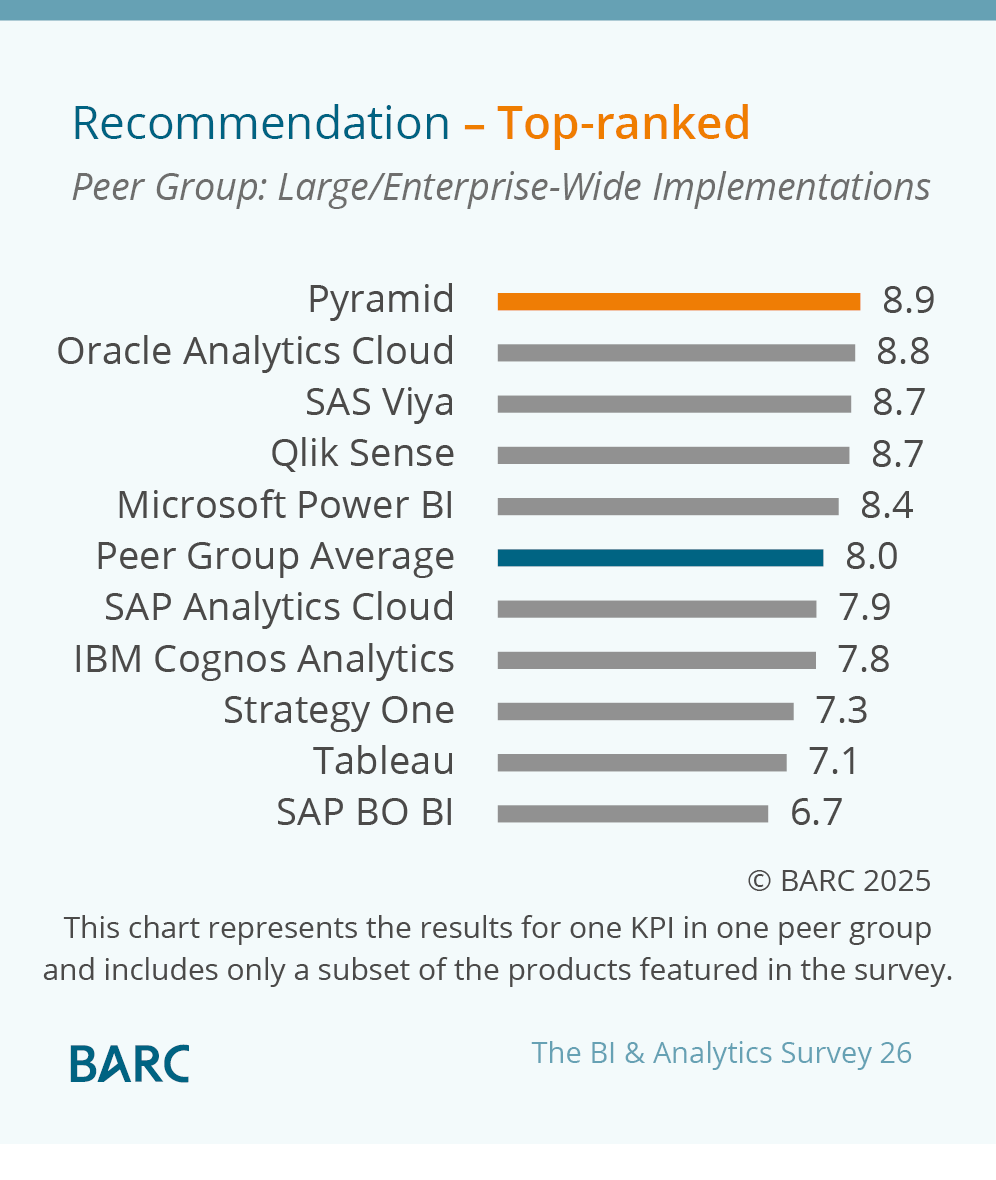
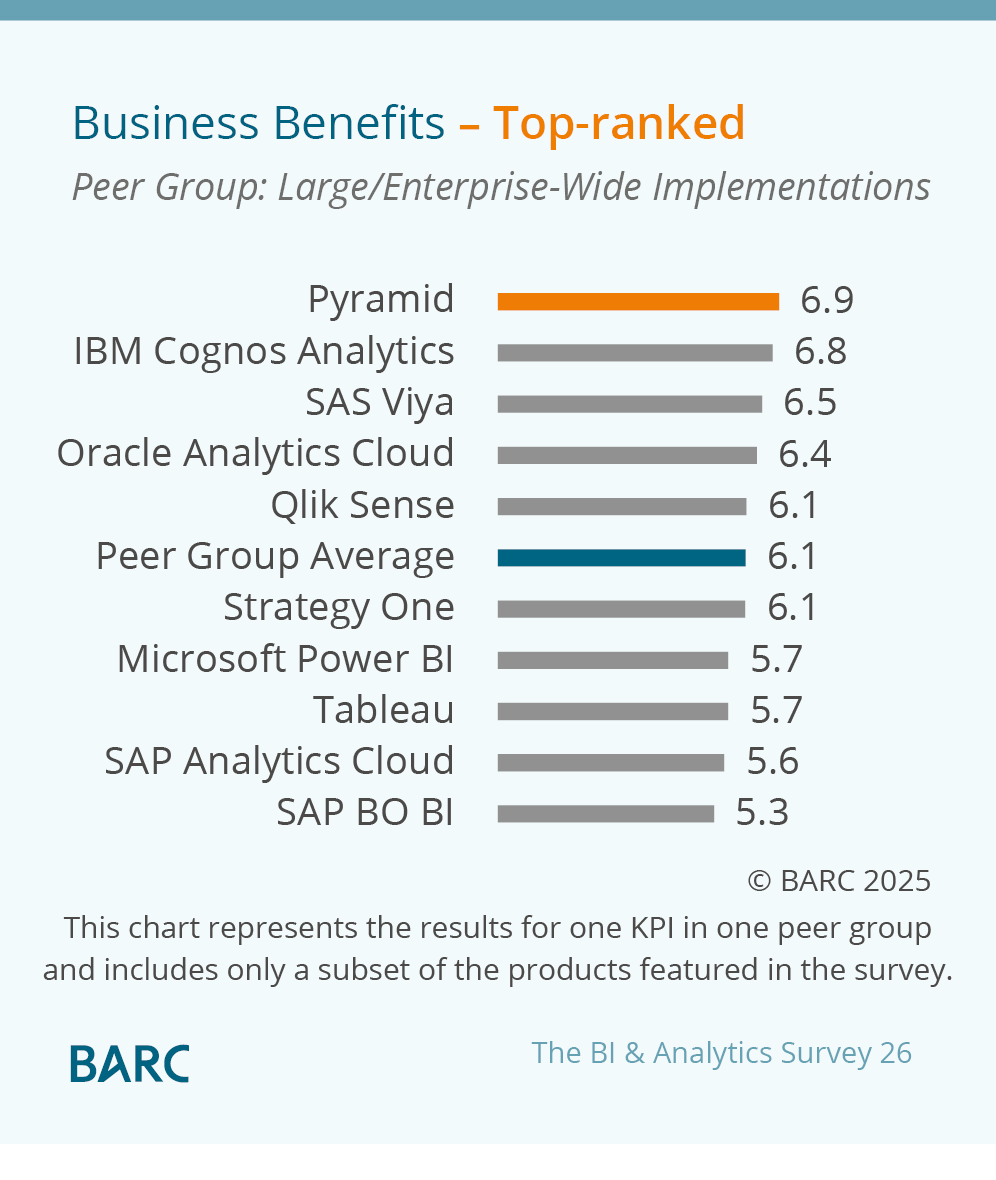
The information and figures are largely drawn from BARC’s The BI & Analytics Survey, The Planning Survey, The Financial Consolidation Survey and The Data Management Survey. You can find out more about these surveys by clicking on the relevant links.

Summary of user review highlights from Pyramid Analytics

What users like about Pyramid Analytics and where the product scores best in a user comparison.

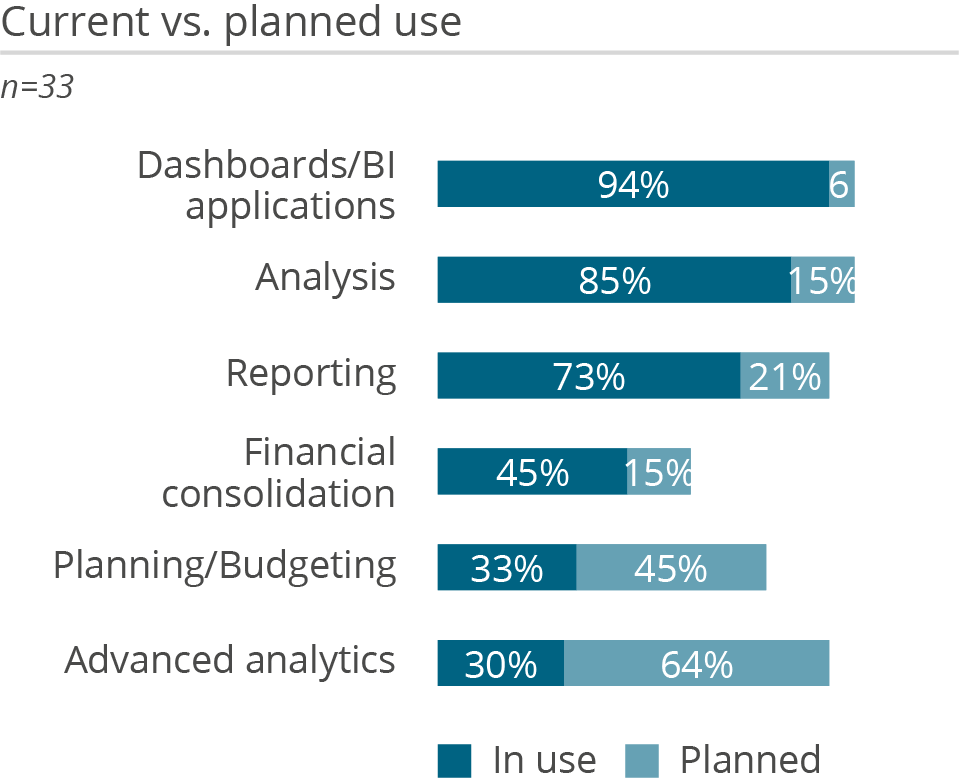
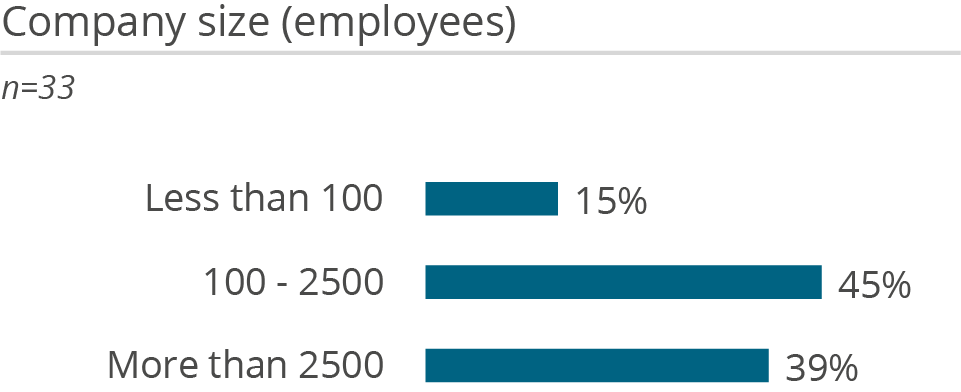
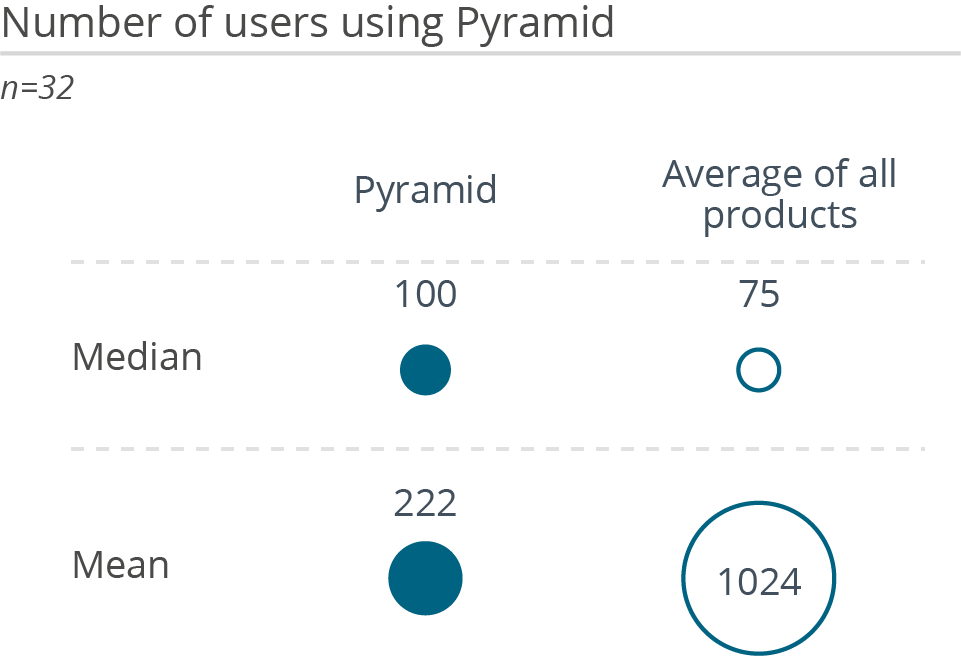
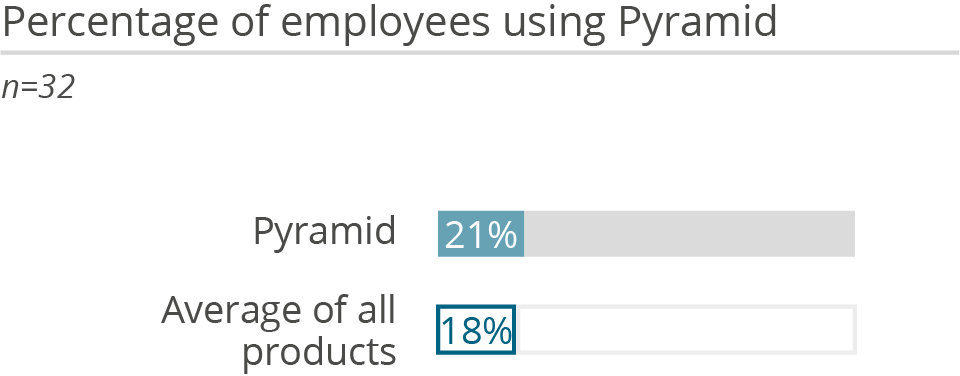
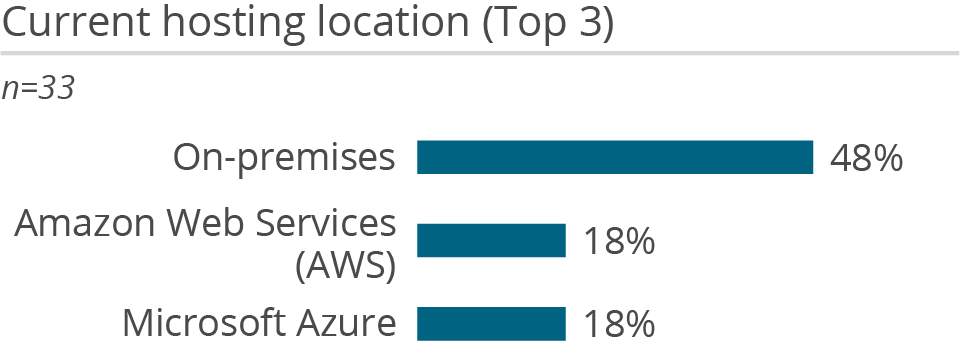
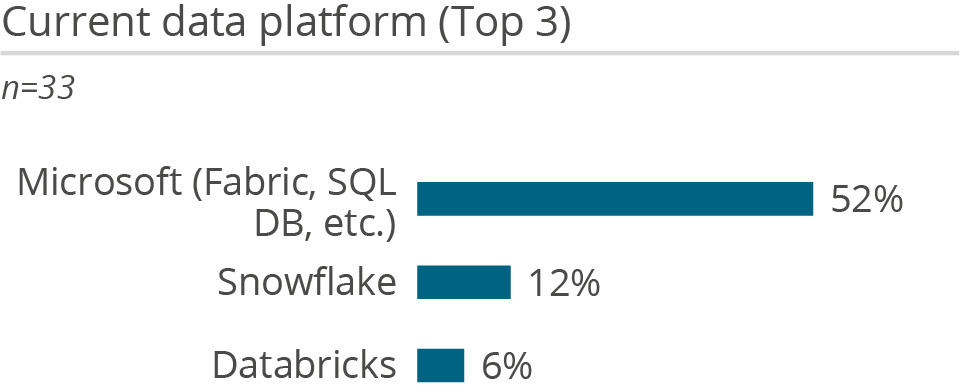
Who uses Pyramid Analytics in a BI & analytics context and how

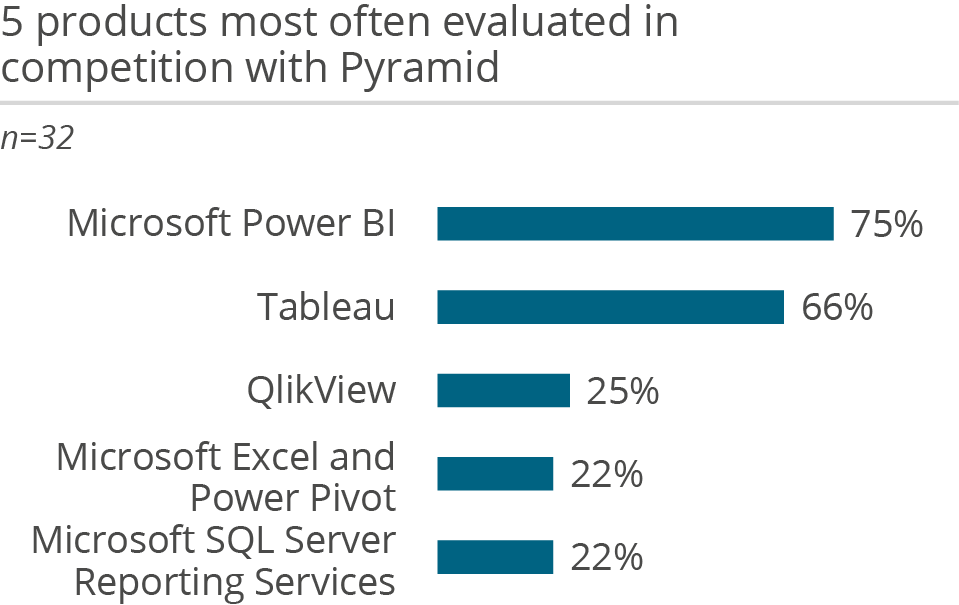
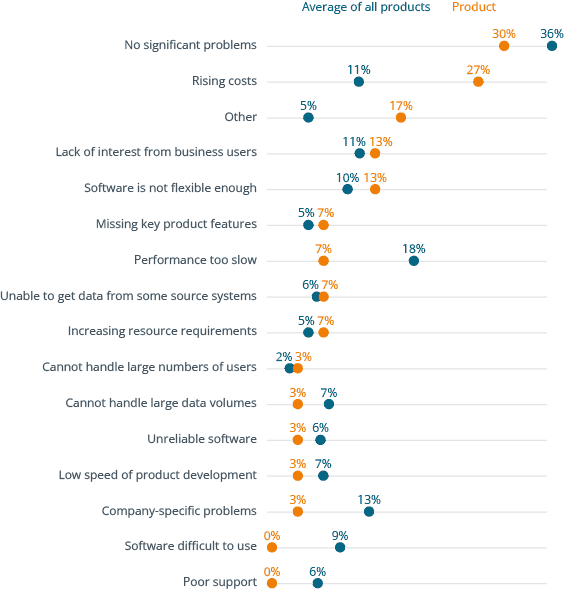
Why users buy Pyramid Analytics and what problems they have using it

Premium content. Unlock with BARC+.
For just €79 per month (€948 per year) you can access all the paid content on www.barc.com.
Your benefits:

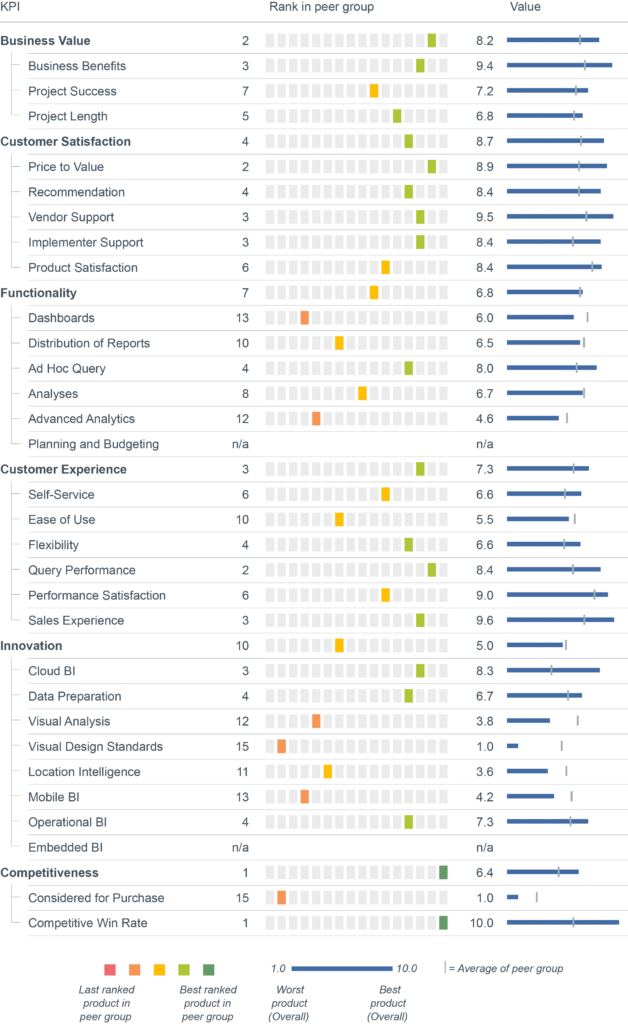
Full user reviews and KPI results for Pyramid Analytics

All key figures for Pyramid Analytics at a glance.

Premium content. Unlock with BARC+.
For just €79 per month (€948 per year) you can access all the paid content on www.barc.com.
Your benefits:

Individual user reviews for Pyramid Analytics

Role
Line of business employee
Number of employees
More than 2.500
Industry
IT
Source
Invited by the vendor, The BI & Analytics Survey 25, 04/2024
What do you like best?

The best aspect of Pyramid Analytics is accessibility to access data and create custom reports in a timely manner.

What do you like least/what could be improved?

Some functions are confusing to manipulate. For example, creating a monthly report to see current month data for all measures and adding the previous year's monthly data for specific measures, not all measures. Each month I manually eliminate via member selection for the measures where previous year's monthly data is not needed. It would be great to change the transaction date hierarchy each month, but keep the specific columns where previous year data is needed.

What key advice would you give to other companies looking to introduce/use the product?

-

How would you sum up your experience?

Pyramid is an excellent tool to help leadership with sales data and strategy.

Role
Consultant
Number of employees
100 - 2.500
Industry
Consulting
Source
Invited by the vendor, The BI & Analytics Survey 25, 06/2024
What do you like best?

Well thought out and full enterprise BI capabilities. Not just a visualization or dashboarding tool.

What do you like least/what could be improved?

Not much, the challenge is the same with any of our BI tools, data prep and modeling. Get those right is important with any tool but the interface works well.

What key advice would you give to other companies looking to introduce/use the product?

A complete Enterprise BI tool, paginated reports to advanced forecasting techniques and visualizations. All managed.

How would you sum up your experience?

Thumbs up.

Role
Project manager for BI/analytics from IT
Number of employees
100 - 2.500
Industry
Manufacturing
Source
Invited by the vendor, The BI & Analytics Survey 25, 06/2024
What do you like best?

Setting up Pyramid Analytics on-premise is very straightforward. It was also quite simple to connect to the various data sources across our company. Consequently, it didn't take long before we had numerous requests to build various reports and dashboards for our users.

What do you like least/what could be improved?

Even though I prefer having the software on-premise, I would like to see a cloud-based version in the future to save time on upgrades and avoid the due diligence required for software updates every six months.

What key advice would you give to other companies looking to introduce/use the product?

Ensure that all features are fully operational through your setup before delving too deeply into report creation. We've encountered issues with single sign-on, website addresses, mobile sites, and AI tools. Although these were not always issues caused by Pyramid, it's worthwhile to resolve these matters before granting access to users.

How would you sum up your experience?

Pyramid is truly exceptional, offering seamless ease of use from creating data models to generating fantastic dashboards. Users can effortlessly build and customize data models, transforming complex data into insightful visualizations. The intuitive dashboards allow users to manipulate and adjust the data to suit their specific needs, empowering them to uncover valuable insights and make informed decisions. This powerful combination of user-friendly data modeling and dynamic dashboards makes Pyramid an indispensable tool for are organization.

Role
Project manager for BI/analytics from business department
Number of employees
More than 2.500
Industry
Education
Source
Invited by the vendor, The BI & Analytics Survey 25, 06/2024
What do you like best?

Ease of use and simplified data model and advanced machine learning and Artificial Intelligence integration.

What do you like least/what could be improved?

My personal lack of time and knowledge to use its advanced features.

What key advice would you give to other companies looking to introduce/use the product?

Allocate dedicated and skilled human resources to use it to gain value.

How would you sum up your experience?

Excellent product.

Role
Project manager for BI/analytics from IT
Number of employees
More than 2.500
Industry
Banking and finance
Source
Invited by the vendor, The BI & Analytics Survey 25, 05/2024
What do you like best?

Time to solution and complete suit with with minimal 3rd party software.

What do you like least/what could be improved?

Imroved logs and mobile offering.

What key advice would you give to other companies looking to introduce/use the product?

Prepare your data model well in order to provide well working large scale solutions.

How would you sum up your experience?

Great product and many dgrees of freedom, allow to implimant any requirement and business scenario.

Role
Project manager for BI/analytics from business department
Number of employees
100 - 2.500
Industry
Banking and finance
Source
Invited by the vendor, The BI & Analytics Survey 25, 05/2024
What do you like best?

Performance, User Interface, tech support.

What do you like least/what could be improved?

Specific non-generic sql language for formulas.

What key advice would you give to other companies looking to introduce/use the product?

There is a real in-memory db (imdb) strong engine in Pyramid that you can use.

How would you sum up your experience?

Friendly to use with little learning curve, superb performance, full feature set.

Role
Head of a separate BI/analytics organization unit
Number of employees
100 - 2.500
Industry
Retail
Source
Invited by the vendor, The BI & Analytics Survey 25, 05/2024
What do you like best?

The tool has this jack-of-all-trade quality as we can keep the business logic, models, ETL, reporting and analytics all in the same place. The ease of use and connectivity is really valuable. In addition, the product is developing really fast, so we have new features to use, quite often.

What do you like least/what could be improved?

The product query performance, got better in the last couple of versions, but is still generally slow. The query mechanism is not flexible enough, so running a dashboard with large underlying data with good performance, proved to be really difficult.

What key advice would you give to other companies looking to introduce/use the product?

Look at what business need your BI tool should serve. If your data is not extremely large, but not very organized and is stored in a lot of different sources Pyramid can be a great option. In addition, if you don't have a lot of technical personal, Pyramid is a great solution - as you can run ETL, complex models and even create reports with Gen BI with no code at all. If you need a power-horse to run large tasks and models Pyramid probably won't be my first choice.

How would you sum up your experience?

Great product! It has much more options and features compared to alternatives, while keeping competitive prices and exciting development roadmap.

Role
Head of a separate BI/analytics organization unit
Number of employees
100 - 2.500
Industry
Insurance
Source
Invited by the vendor, The BI & Analytics Survey 25, 05/2024
What do you like best?

Very easy to use, data modeling is easy, many visualizations are available, self-service capabilities are a huge plus, many advanced features available.

What do you like least/what could be improved?

Performance, instrumentation, partner community, consulting services.

What key advice would you give to other companies looking to introduce/use the product?

Good product for self service analytics, good for creating and publishing dashboards, embedded features are very good, robust API support.

How would you sum up your experience?

Good organization, has good customer support.

Role
Project manager for BI/analytics from IT
Number of employees
100 - 2.500
Industry
Insurance
Source
Invited by the vendor, The BI & Analytics Survey 25, 05/2024
What do you like best?

Ease of use and rich dashboarding features.

What do you like least/what could be improved?

Lack of pixel perfect parameterized reporting capability.

What key advice would you give to other companies looking to introduce/use the product?

-

How would you sum up your experience?

Users like it.

Role
Head of a separate BI/analytics organization unit
Number of employees
Less than 100
Industry
Healthcare
Source
Invited by the vendor, The BI & Analytics Survey 25, 05/2024
What do you like best?

The flexibility in creating ETL models. Even if there isn't a stock connection or manipulation available for the type of data, the ease of using R & Python scripting or even OS calls in extracting or transforming the data makes it easy to use this for all ETL functions, even ones it wasn't designed for.

What do you like least/what could be improved?

Geocoding and mapping is somewhat difficult to use and the options are limited with the map visualizations.

What key advice would you give to other companies looking to introduce/use the product?

Focus on and learn the modeling portion inside and out. Extra time spent on getting skillful in this area will be paid back with the ease of creating visuals and dashboards. Also, set enterprise-level naming conventions and standards early on. It can be difficult to detangle these problems after implementation.

How would you sum up your experience?

Great product, they are adding features much quicker than I expected. Support is very good and in the event a bug is found, I've haven't had to wait more than 1 release later to get a fix.

Role
Line of business employee
Number of employees
100 - 2.500
Industry
Public sector
Source
Invited by the vendor, The BI & Analytics Survey 25, 04/2024
What do you like best?

Schneller und guter Support. Funktionsweise und Zyklus von Updates.

What do you like least/what could be improved?

Performance. Teilweise Wegnahme von (nützlichen und hilfreichen) Funktionen.

What key advice would you give to other companies looking to introduce/use the product?

Leistungsstarke (virtuelle) Server verwenden. Support nur auf Englisch.

How would you sum up your experience?

Im großen und ganzen Zufriedenheit im Funktionsumfang, aber teilweise Unzufriedenheit bei Performance und Entscheidungen des Herstellers (teilweise werden hilfreiche Funktionen weggenommen).

Role
Project manager for BI/analytics from business department
Number of employees
More than 2.500
Industry
Healthcare
Source
BARC Marketing, The BI & Analytics Survey 25, 05/2024
What do you like best?

Ability to comment on analytics, ease of use, support, IMDB.

What do you like least/what could be improved?

Upgrade issues.

What key advice would you give to other companies looking to introduce/use the product?

Can do what many other systems can do, can map data from multiple sources on same dashboard.

How would you sum up your experience?

Very pleased with the system and support we have received.

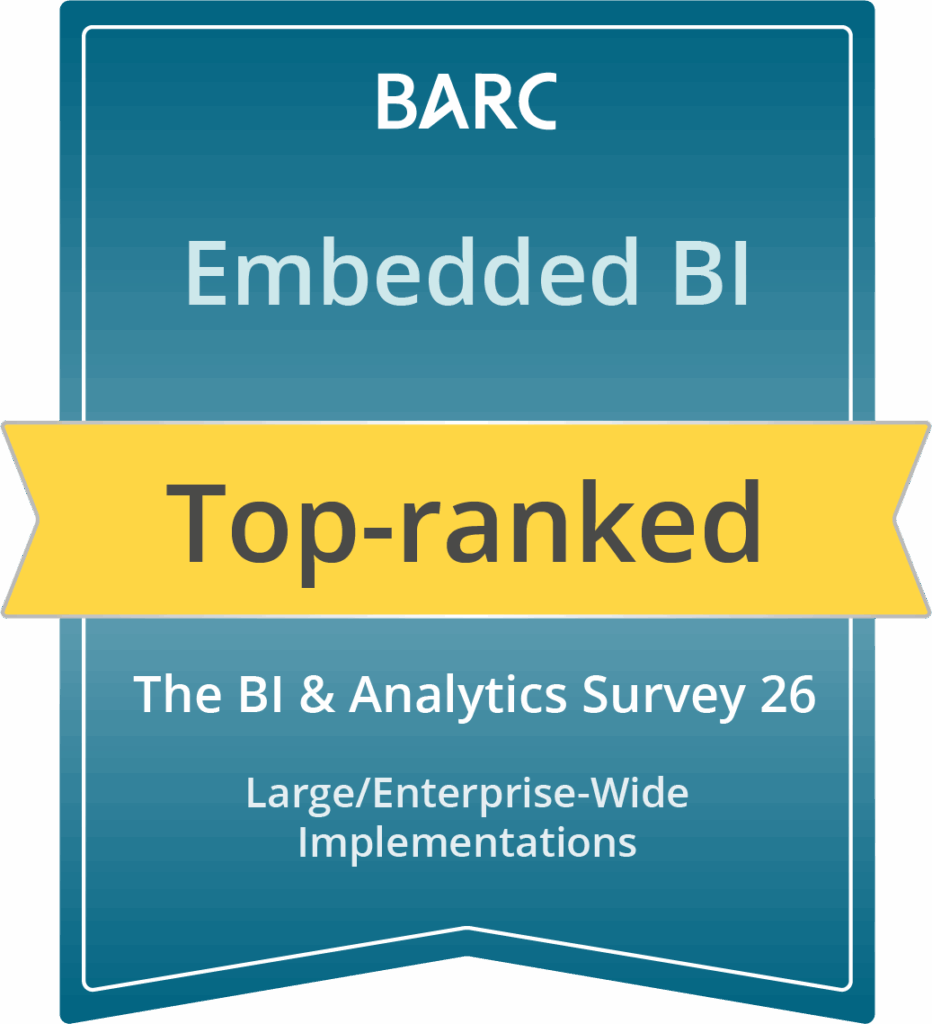
Awards
Survey Information
Number of reviews for Pyramid Analytics
28
Reviewed versions
63% Version 2020.23, 5% version 2020.24, 5% version 2020.25, 26% other 2020 versions
Peer groups in the survey
Large/Enterprise-Wide Implementations, Report & Dashboard Focus, Analysis Focus
Don‘t miss out!
Join over 25,775 data & analytics professionals and get the latest product insights, research, surveys and more!
Check out the world´s most comprehensive guide to the Power BI ecosystem.