Customer Satisfaction
4.4/10
4.4
User Experience
5/10
5
Functionality
4.7/10
4.7
Business Value
6.1/10
6.1

QlikView

What is QlikView?

Visualization and analysis platform (consisting of desktop and web client) with functionality for set-based (assosiative) analysis and creation of individual dashboard applications.

BI, Analytics & CPM
●● Reporting / Dashboards
●● Analysis
● Advanced Analytics
– Planning
– Financial Consolidation

= Function covered, ●● = Functional focus

= Function covered
●●
= Functional focus

About QlikView

The information in this section has been provided by the vendor of QlikView.

Self-description of the vendor

No vendor self-description available
References
No data available
Partners
No data available

QlikView BARC Review & Rating

This section contains our independent analyst views on QlikView.

Provider and product description

Qlik, originally founded in 1993 in Lund, Sweden, moved its headquarters to the United States in 2005 after raising funds from several venture capital firms. Qlik is currently owned by the private equity company Thoma Bravo after its acquisition in 2016. Since then, the vendor has made a number of acquisitions to create a robust cloud platform that delivers the data integration and analytics organizations need to transform raw data into informed action.

QlikView® was the vendor’s first analytics product and the tool it became famous with. It is a dashboard and analysis product that made in-memory technology in analytics and BI widely popular. The QIX engine still delivers exceptional performance for highly responsive analyses and interactive dashboards. QlikView® was the first tool marketed under the ‘data discovery’ and ‘modern BI’ terms to differentiate it from established BI suites. It was positioned as a self-service tool targeted at business users, enabling them to analyze data without having to consult developers for new reports, dashboards or analyses on new data sets.

QlikView® is still in use at many organizations but no longer actively marketed to new customers. To ensure compatibility, at least one QlikView® release per year is provided with improvements ranging from technical health to integration in the Qlik portfolio. QlikView applications can be run in Qlik Sense® or Qlik Cloud®, which makes migrations much easier, especially when dealing with large implementations.

QlikView® was originally developed as a desktop solution with a Windows client (QlikView® Desktop). It can still be used in this way, and often is, but Qlik has moved away from the desktop to a web-based architecture (QlikView® Server). QlikView® Desktop is used for data preparation (extract, transform, load) as well as for building applications. A core strength of QlikView® Desktop is that it seamlessly combines content consumption and creation in a single mode. This makes the software very flexible to analyze data and enrich and reshape it for further inquiries. QlikView® applications (‘apps’) can be hosted on the web as guided apps (e.g., dashboards or analytical applications) or delivered as complete apps with the data to users who use the local client to access server-based apps.

The QlikView® Publisher component is used to handle data reloads and the distribution of QlikView apps to users. Qlik NPrinting® (a separately licensed on-premises product) provides centralized report creation and distribution using data and visualizations from QlikView®.

Strengths and challenges of QlikView

BARC’s viewpoint on the product’s strengths and challenges.

Strengths
  • Qlik sets itself high expectations regarding query performance and hardly ever falls short of them thanks to its mature in-memory engine
  • Easy-to-use data navigation for end users through ‘associative’ queries and interactive visualizations
  • Proven suitability for fast and iterative implementation and app modification based on mature and stable software
Challenges
  • Few new features and innovation in QlikView because Qlik Sense® is the vendor’s primary, modern BI and analytics front end
  • Limited built-in functionality for data governance to align KPI definitions and ensure consistent use of master data across multiple applications
  • Outdated user interface and visualization lacking visual appeal and embedding options for leading analytics applications
  • Data preparation requires extensive scripting and loading of all data into Qlik’s own in-memory engine
Need more help finding the right software?

Find out how our expertise can help you.

QlikView User Reviews & Experiences

The information contained in this section is based on user feedback and actual experience with QlikView.

The information and figures are largely drawn from BARC’s The BI & Analytics Survey, The Planning Survey, The Financial Consolidation Survey and The Data Management Survey. You can find out more about these surveys by clicking on the relevant links.

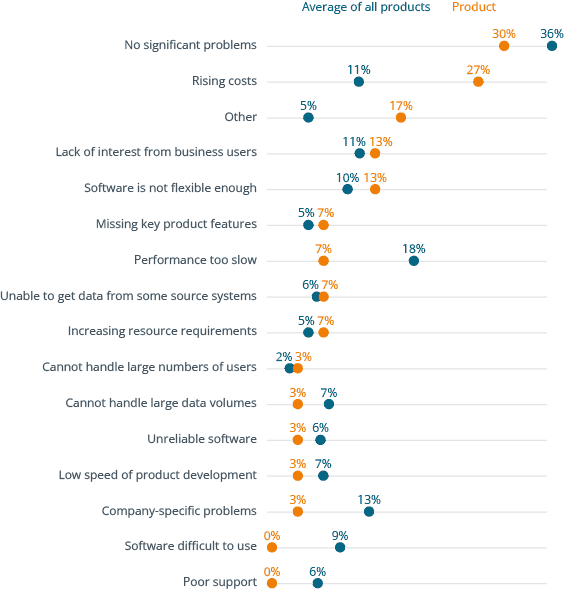
Why users buy QlikView and what problems they have using it

Premium content. Unlock with BARC+.
For just €79 per month (€948 per year) you can access all the paid content on www.barc.com.
Your benefits:

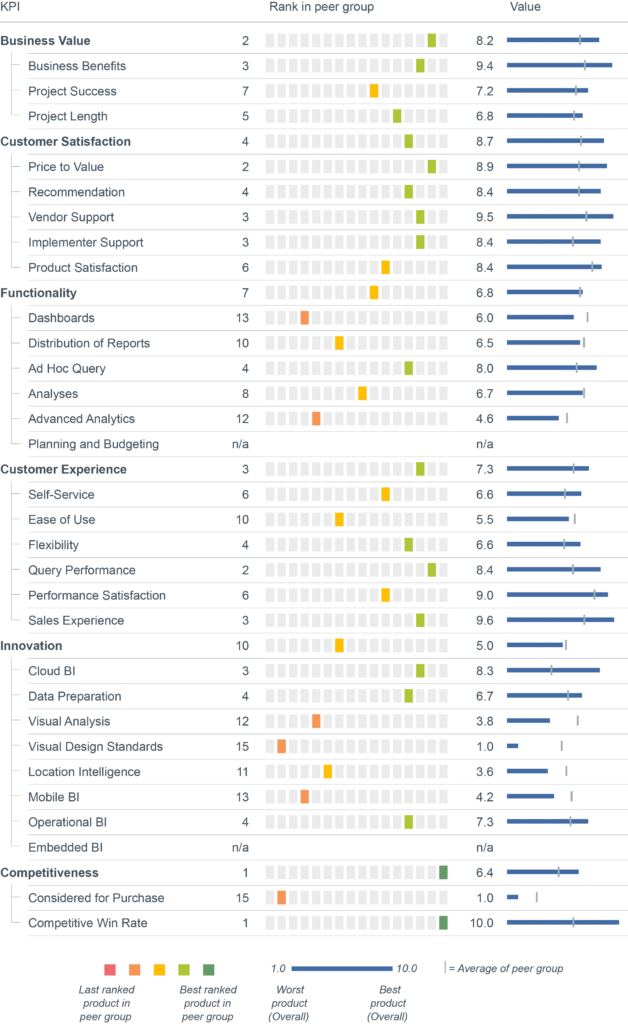
Full user reviews and KPI results for QlikView

All key figures for QlikView at a glance.

Premium content. Unlock with BARC+.
For just €79 per month (€948 per year) you can access all the paid content on www.barc.com.
Your benefits:

Individual user reviews for QlikView

Role
IT employee
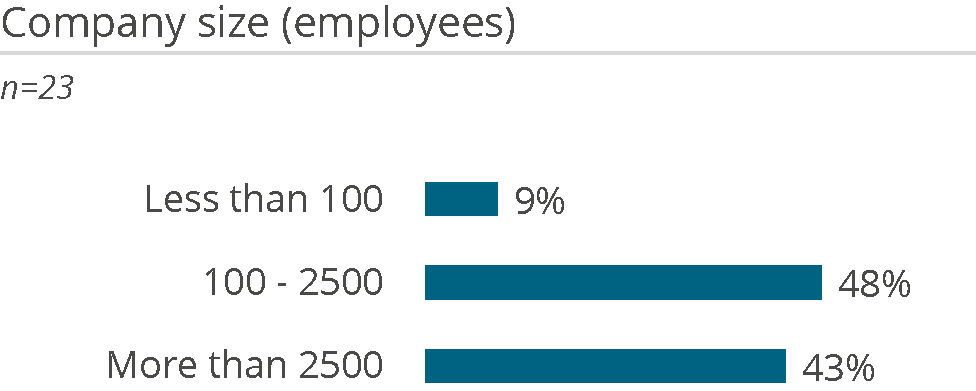
Number of employees
More than 2.500
Industry
Banking and finance
Source
BARC Panel, The BI & Analytics Survey 25, 04/2024
What do you like best?

Associative methodology. Cognitive capabilities. Qlik nation site for following latest news and product updates

What do you like least/what could be improved?

Licensing and administration capabilities.

What key advice would you give to other companies looking to introduce/use the product?

Plan ahead for licensing needs to choose the correct licensing plan.

How would you sum up your experience?

Great product and implements latest technology.

Role
Project manager for BI/analytics from business department
Number of employees
More than 2.500
Industry
Manufacturing
Source
BARC Panel, The BI & Analytics Survey 25, 05/2024
What do you like best?

Bewährte gute Lösung, die seit vielen Jahren global im Einsatz ist.

What do you like least/what could be improved?

Veraltet, wird daher ersetzt. Grafikmöglichkeiten nicht mehr State of the Art.

What key advice would you give to other companies looking to introduce/use the product?

Obwohl QlikView eine sehr gute Lösung ist, ist sie dennoch veraltet. Daher bitte Qlik Sense oder eine Lösung eines anderen Anbieters nutzen.

How would you sum up your experience?

-

Role
Head of a separate BI/analytics organization unit
Number of employees
More than 2.500
Industry
Insurance
Source
BARC Panel, The BI & Analytics Survey 25, 03/2024
What do you like best?

Performance, technische Möglichkeiten.

What do you like least/what could be improved?

Integration eines modernen Datenmodellierungsstools.

What key advice would you give to other companies looking to introduce/use the product?

Trial and Error Methode nutzen, selbstverständliche Standards definieren.

How would you sum up your experience?

Super schnell produktiv nutzbare Auswertungen, es gibt quasi keine Grenzen der Auswertbarkeit.

Role
Project manager for BI/analytics from IT
Number of employees
100 - 2.500
Industry
Insurance
Source
BARC Panel, The BI & Analytics Survey 25, 05/2024
What do you like best?

DIe Variabilität der unterschiedlichen Datenbanken, die angeschlossen und abgefragt werden können.

What do you like least/what could be improved?

Manchmal lange Laufzeiten bei großen Datenmengen.

What key advice would you give to other companies looking to introduce/use the product?

Genaue Anlaysen der Datenmengen.

How would you sum up your experience?

Wir haben sehr gute Erfahrungen gemacht und lernen aus den Fehlern, die zu Beginn gemacht wurden.

Role
Employee of a cross-departmental BI/analytics team
Number of employees
100 - 2.500
Industry
Media/Publishing
Source
BARC Panel, The BI & Analytics Survey 25, 04/2024
What do you like best?

Ability to knit complex data sources together and manipulate data along the way to create a relevant bespoke customer view.

What do you like least/what could be improved?

Tough initial learning curve to get up to speed with how it works and all the available options for customizing.

What key advice would you give to other companies looking to introduce/use the product?

Plan what you want to get out of it well and collaborate with end users who will be using the end product. Do not underestimate the time it will take to develop the user dashboard part.

How would you sum up your experience?

Love it for knitting data together now I am more up to speed. Allows for quick analysis.

Role
Project manager for BI/analytics from business department
Number of employees
More than 2.500
Industry
Manufacturing
Source
BARC Panel, The BI & Analytics Survey 25, 03/2024
What do you like best?

Super schnelle Entwicklung eines lauffähgen Dashboards mit Datenmengen bis ca. 50 GB.

What do you like least/what could be improved?

Keinerlei Weiterentwicklung seit Jahren und Qlik Sense ist keine Alternative für die essentiellen & hervorragenden Funktionalitäten von QlikView.

What key advice would you give to other companies looking to introduce/use the product?

-

How would you sum up your experience?

War Super und es gibt aktuell für Echtzeit-InMemory Analytics noch wenig gleich gute Alternativen.

Role
Experte Data and Analytics
Number of employees
More than 2.500
Industry
Insurance
Source
BARC Panel, The BI & Analytics Survey 25, 05/2024
What do you like best?

Intuitive Benutzung, schnelle Ergebnisse, innovatives Konzept.

What do you like least/what could be improved?

Die korrespondierende Cloud-Lösung Qlik Sense hat an Qualität verloren.

What key advice would you give to other companies looking to introduce/use the product?

Gut für einfachen Analysen, Insights - weniger gut für Dashboarding. Governance vorgeben, damit kein Wildwuchs entsteht.

How would you sum up your experience?

Kann man schnell lernen und nutzen. Man kann aber auch viele Fehler machen.

Role
Project manager for BI/analytics from business department
Number of employees
100 - 2.500
Industry
Manufacturing
Source
BARC Panel, The BI & Analytics Survey 25, 04/2024
What do you like best?

Unmittelbar umsetzbare Ergebnisse.

What do you like least/what could be improved?

Nachfolgeprodukt Qlik Sense verwenden.

What key advice would you give to other companies looking to introduce/use the product?

Schauen Sie sich Qlik Sense als Nachfolgeprodukt von QlikView an!

How would you sum up your experience?

Sehr gut. Es war sehr erfreulich, dass zwischenzeitlich unser ERP-Hersteller auch QlikView als OEM mit in sein Lizenzierungsumfang aufgenommen und standardisierte Datenmodelle /-Cockpits aufgenommen hat. Es ist aber ein End-of-Life absehbar.

Role
Head of a separate BI/analytics organization unit
Number of employees
More than 2.500
Industry
Medical technology
Source
BARC Panel, The BI & Analytics Survey 25, 05/2024
What do you like best?

Hohe Produktqualität. Produkt existiert schon länger am Markt, liefert aber immer noch eine hohe Performance.

What do you like least/what could be improved?

Die erstellten Applikationen sind nicht responsive. Das ist erst möglich mit dem neuen Produkt aus dem Hause Qlik: Qlik Sense.

What key advice would you give to other companies looking to introduce/use the product?

Sich am Anfang genau überlegen, was möchte man später aus den erzeugten Daten ableiten, um frühzeitig zu erkennen, ob alle benötigten Daten zu Projektbeginn bekannt sind. Datenqualitätsmanagement. Themen nicht unterschätzen, da dies unter Umständen große Auswirkungen auf die Ergebnisse der Applikationen haben kann.

How would you sum up your experience?

Wir sind jetzt seit 2010 mit QlikView unterwegs. QlikView bietet eine große Flexibilität und durch die komplette Integration von Datenbeschaffung, Datenaufbereitung, Modellierung und Erzeugung von Applikationen hat man alles in einer Software und kann daher schnell Anpassungen vornehmen.

Role
IT employee
Number of employees
100 - 2.500
Industry
Manufacturing
Source
BARC Panel, The BI & Analytics Survey 25, 04/2024
What do you like best?

Flexibilität. Geringer Aufwand bis zum Going Live.

What do you like least/what could be improved?

Es wird nicht mehr weiterentwickelt.

What key advice would you give to other companies looking to introduce/use the product?

Qlik Sense nutzen.

How would you sum up your experience?

-

Role
Project manager for BI/analytics from IT
Number of employees
More than 2.500
Industry
Manufacturing
Source
BARC Panel, The BI & Analytics Survey 25, 05/2024
What do you like best?

Simplicité de mise en oeuvre et d'usage.

What do you like least/what could be improved?

Interface utilisateur à améliorer.

What key advice would you give to other companies looking to introduce/use the product?

-

How would you sum up your experience?

Très bonne opinion.
Role
Employee of a cross-departmental BI/analytics team
Number of employees
100 - 2.500
Industry
IT
Source
BARC Marketing, The BI & Analytics Survey 25, 05/2024
What do you like best?

The ETL ease of use.

What do you like least/what could be improved?

The web view.

What key advice would you give to other companies looking to introduce/use the product?

It is a great Data warehouse ETL and BI tool.

How would you sum up your experience?

Top notch technology.

Survey Information
Number of reviews for QlikView
40
Reviewed versions
95% version 12, 5% version 11
Peer groups in the survey
Large/Enterprise-Wide Implementations, Report & Dashboard Focus, International BI Giants
Don‘t miss out!
Join over 25,775 data & analytics professionals and get the latest product insights, research, surveys and more!
Check out the world´s most comprehensive guide to the Power BI ecosystem.