

Salesforce Tableau
What is Salesforce Tableau?
Business-user-oriented BI solution for visual ad hoc analysis, data preparation, and dashboards with access to many data sources and its own visual query language. Tableau Next offers a version tailored for Salesforce customers.
Customer Satisfaction
6.9
★★★★★★★★★★ Rated 6.9 out of 10
User Experience
7.3
★★★★★★★★★★ Rated 7.3 out of 10
Functionality
7.0
★★★★★★★★★★ Rated 7 out of 10
Business Value
6.6
★★★★★★★★★★ Rated 6.6 out of 10
Self-description of Salesforce Tableau
No vendor self-description available
About BARC Reviews
Would you like to find out more about BARC reviews? Our FAQs answer the most important questions.
References
No data available
Partners
No data available
Case studies from this vendor
BARC studies, events and webinars with this vendor
Salesforce Tableau BARC Review & Rating
Provider and product description
Founded in 2003, Tableau emerged from scientific research at Stanford University and is now among the best-known BI & analytics brands worldwide. Following its acquisition by Salesforce in 2019, the company continued to operate largely as an independent BI vendor. With the recent launch of its Tableau Next platform, Tableau has built on Salesforce’s investments in data, agentic AI and trust layers to advance its vision of empowering all users to analyze data and take informed action based on trusted insights. Tableau Next aims to deliver a new approach to business intelligence by using AI-powered autonomous agents to analyze data, proactively share insights and take action to enable humans and AI agents to work together from data to insights to action. Besides the visualization tool, Tableau Next includes Tableau Semantics, a semantic layer with AI-supported modeling features, to deliver actionable insights into users’ workflows.
Tableau remains committed to developing software that requires little training and allows business users to interpret data, mostly by means of interactive visualization and making decisions based on analytics. The intuitive user interface, built-in intelligence and option for in-memory data processing to optimize performance all contribute to the popularity of this solution for visual analysis, dashboards and data discovery. The product offers solid support for analysts through various features such as one-click analyses, data explanations and highlighting anomalies in data.
Tableau’s openness to a variety of data sources is one of its strengths, as it is not necessary to rehost data to use Tableau. The solution allows users to query data live from different data sources, to combine data from across these sources, or to move the data into its own ‘Hyper’ in-memory database for analysis. To ensure performance, Tableau optimizes live queries to generate the most efficient SQL and converts it to source-native dialect. Moreover, to reduce data movement, the product utilizes pushdown optimizations and its federated query cost-based optimizer. The vendor aims to do processing as close to the data as possible, even across different sources.
Data preparation in Tableau can be quick as many manipulations can be made directly while analyzing data, enabling a truly iterative approach to data discovery. With Tableau Prep, data preparation has been enhanced with deeper functionality and a more visual approach with recommendations for data shaping, profiling and enhanced traceability. Tableau Prep transformation flows can be created either on the desktop or via Tableau Cloud and may be scheduled and orchestrated on the server to operationalize data preparation tasks. Data science scripts such as R and Python can be dynamically integrated into Tableau’s data prep and analysis features.
With regards to AI, the Agent feature uses the Einstein Trust Layer and leverages LLMs to support customers with natural language capabilities (e.g., via creating calculations or suggesting visualizations). Tableau Pulse is a natural-language, metrics-based feature equipped with AI functionality to guide users to needed insights and assist in interpreting them. Additionally, the auto-ML capabilities of Salesforce’s Einstein Discovery integrated with Tableau provide advanced predictions and recommended next best actions.
The vendor is actively pursuing the expansion of its active community. Tableau Exchange is a platform for partners to provide a growing catalog of offerings including Viz Extensions (recently announced), connectors and accelerators (prebuilt dashboards).
Strengths and challenges of Salesforce Tableau
BARC’s viewpoint on the product’s strengths and challenges.
Strengths
- Agentic platform combining data, semantics, visualization and action layers with an easy-to-use interface and effective user guidance, resulting in strong adoption by both data-savvy and casual users.
- Visual analysis with built-in user guidance and good interactivity enables business users to find answers to urgent business questions, even in cluttered data sets.
- Data profiling and recommendations are part of data preparation, which supports access to a broad number of data sources (live and cached) including cross-database joins.
- Interactive, mobile-ready and appealing dashboards and data stories are built with little effort by compiling, combining and refining data visualizations.
- Extended analytical capabilities with machine learning via Einstein Discovery.
Challenges
- Although an increasing amount of functionality (and Prep Builder) is available on the web, Desktop is still needed for certain data sources. Furthermore, not all data preparation functions can be leveraged when running live queries from Desktop.
- The platform’s formatted reporting capabilities lack the advanced formatting and distribution features that distinguish top performers in this domain.
- Historically coming from a rather simple offering, the latest innovations and integrations have created an extensive portfolio, which can make it difficult for customers to understand the nuances in features across offerings.
Salesforce Tableau User Reviews & Experiences
The information contained in this section is based on user feedback and actual experience with Salesforce Tableau.
The information and figures are largely drawn from BARC’s The BI & Analytics Survey, The Planning Survey, The Financial Consolidation Survey and The Data Management Survey. You can find out more about these surveys by clicking on the relevant links.
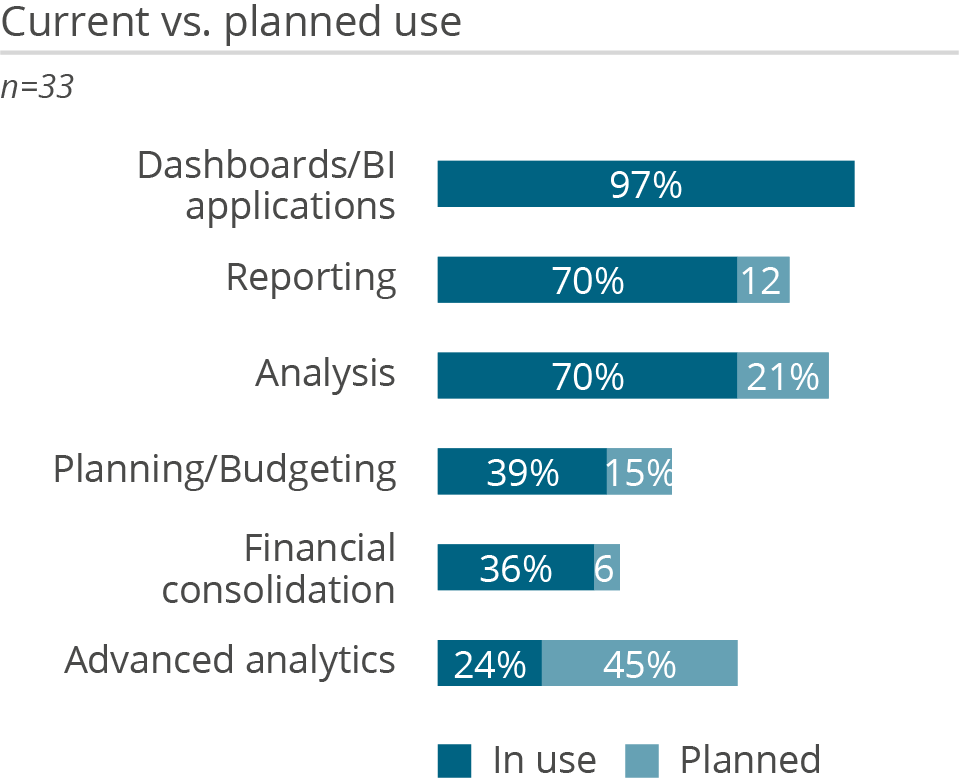
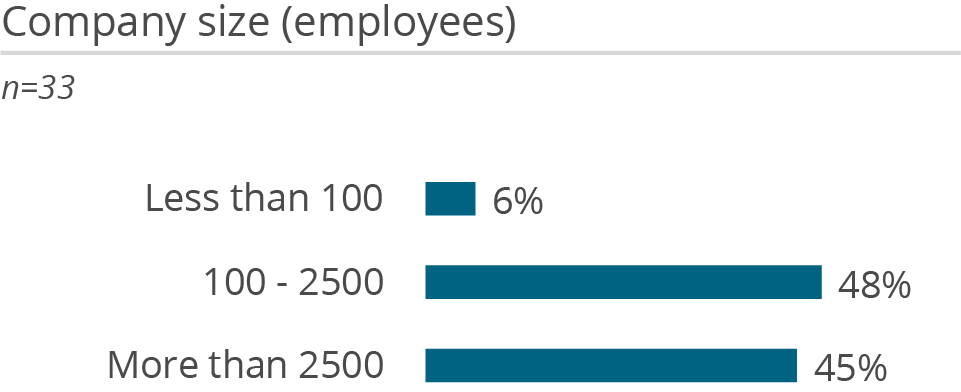
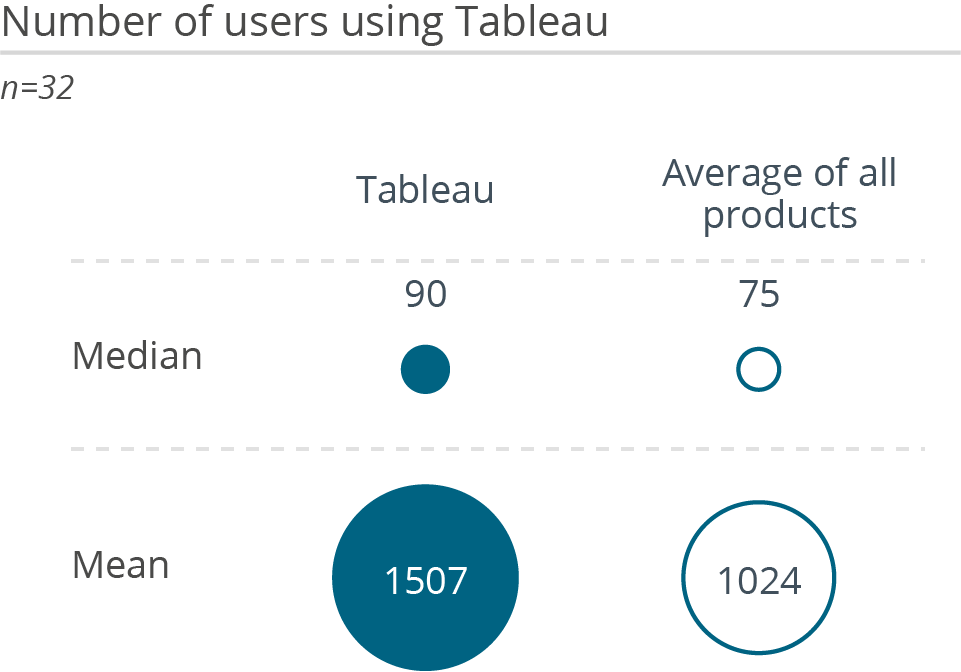
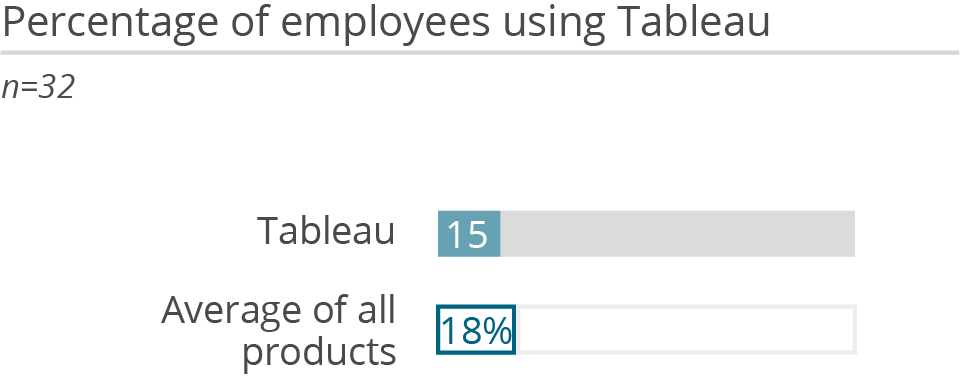
Who uses Salesforce Tableau in a BI & analytics context and how
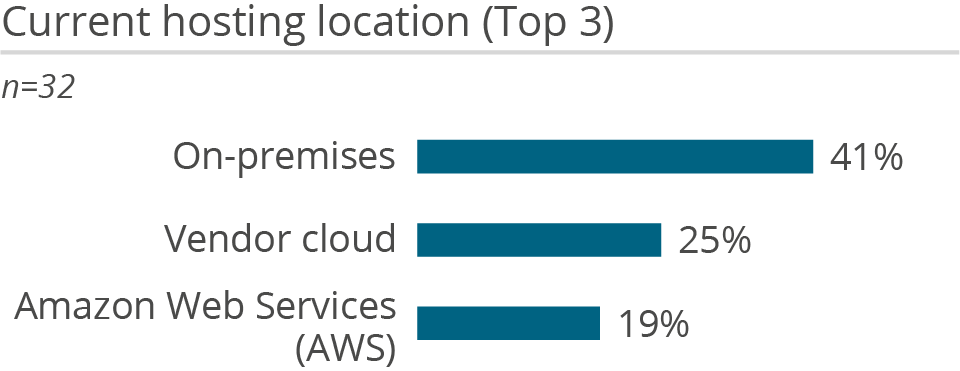
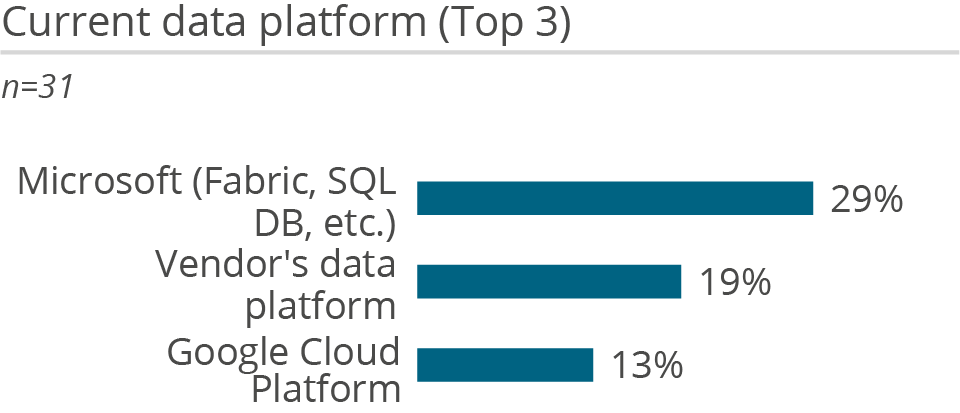
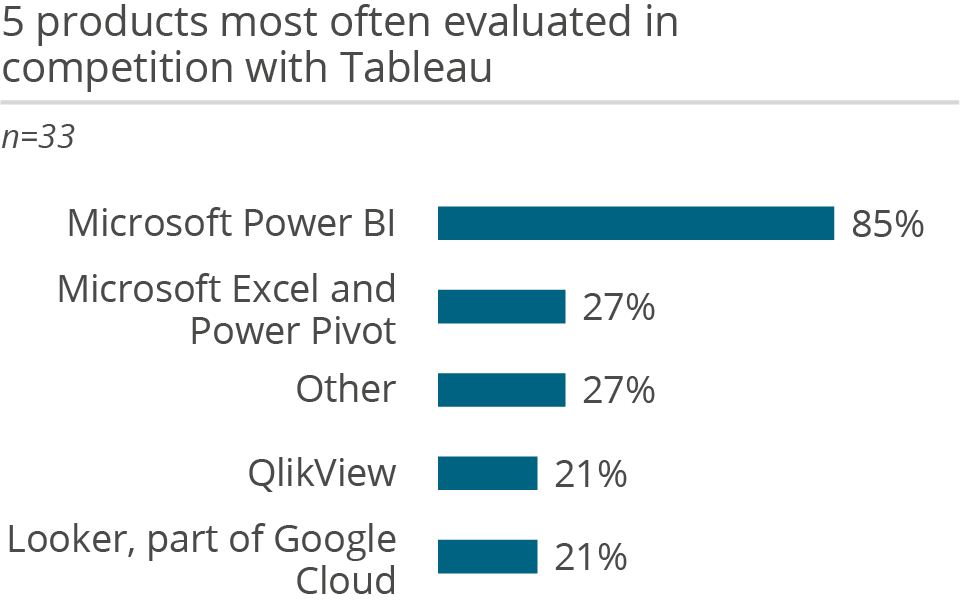
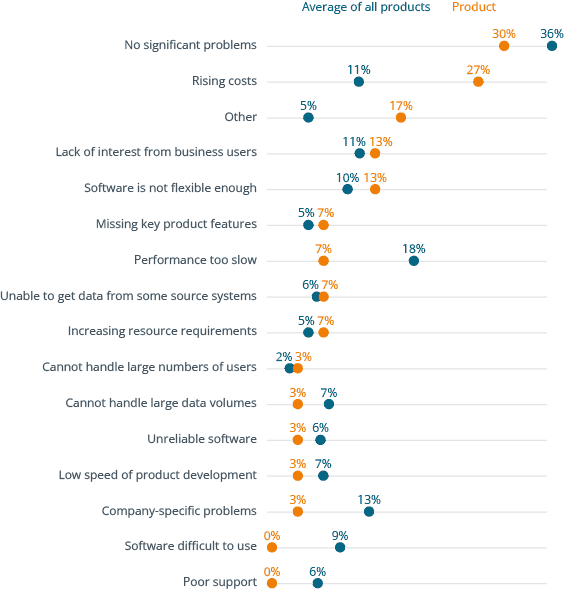
Why users buy Salesforce Tableau and what problems they have using it

Premium content. Unlock with BARC+.
For just €79 per month (€948 per year) you can access all the paid content on www.barc.com.
Your benefits:
- Get independent information on software solutions, market developments and trends in data, analytics, business intelligence, data science and corporate performance management.
- Make data & analytics decisions based on numbers, data, facts and expert knowledge
- Access to all premium articles and all our research, including all software comparison studies, scores and surveys.
- Unlimited access to the BARC media library
- Consume unlimited content anywhere
Full user reviews and KPI results for Salesforce Tableau
All key figures for Salesforce Tableau at a glance.
Premium content. Unlock with BARC+.
For just €79 per month (€948 per year) you can access all the paid content on www.barc.com.
Your benefits:
- Get independent information on software solutions, market developments and trends in data, analytics, business intelligence, data science and corporate performance management.
- Make data & analytics decisions based on numbers, data, facts and expert knowledge
- Access to all premium articles and all our research, including all software comparison studies, scores and surveys.
- Unlimited access to the BARC media library
- Consume unlimited content anywhere
Individual user reviews for Salesforce Tableau

Role
Project manager for BI/analytics from IT
Number of employees
100 - 2.500
Industry
Banking and finance
Source
BARC Panel, The BI & Analytics Survey 26, 05/2025
What do you like best?
Easy dashboard creation.
What do you like least/what could be improved?
AI is only for the cloud.
What key advice would you give to other companies looking to introduce/use the product?
Create a proof of concept to evaluate Tableau.
How would you sum up your experience?
It is a very good BI platform.
Role
Consultant
Number of employees
More than 2.500
Industry
Healthcare
Source
BARC Panel, The BI & Analytics Survey 26, 03/2025
What do you like best?
The presentation layer when in the tool.
What do you like least/what could be improved?
Lacking offline display for consistent print-like output.
What key advice would you give to other companies looking to introduce/use the product?
Align with your architecture standards, which should include analysis of embedded analytics and intelligence tools.
How would you sum up your experience?
Positive and they continue to evolve the tools.
Role
Consultant
Number of employees
More than 2.500
Industry
Consulting
Source
BARC Panel, The BI & Analytics Survey 26, 05/2025
What do you like best?
Flexibilität, Schnittstellen.
What do you like least/what could be improved?
Performance.
What key advice would you give to other companies looking to introduce/use the product?
Zeit nehmen und die Daten verstehen.
How would you sum up your experience?
Gut.
Role
Project manager for BI/analytics from business department
Number of employees
More than 2.500
Industry
Services
Source
BARC Panel, The BI & Analytics Survey 26, 05/2025
What do you like best?
Ease of use in creating ad-hoc queries or saved routines for month-end reporting.
What do you like least/what could be improved?
As we are not in the cloud, we don't always get the latest updates implemented in a timely manner.
What key advice would you give to other companies looking to introduce/use the product?
It is a very strong contender for finance-oriented analysis. It might be a little too technical for non-finance users compared with Power BI visuals.
How would you sum up your experience?
Favourable.
Role
Consultant
Number of employees
More than 2.500
Industry
Consulting
Source
BARC Panel, The BI & Analytics Survey 26, 05/2025
What do you like best?
Tableau excels at turning questions into visuals quickly thanks to its drag-and-drop canvas, broad library of live data connectors, and the new AI-assisted features (Pulse and Copilot) that surface insights automatically. Strong governance tools and open APIs let large enterprises embed dashboards confidently while drawing on a huge global talent pool and community resources.
What do you like least/what could be improved?
Its biggest drawbacks are the premium license costs and the complexity of deciding who needs Creator, Explorer, or Viewer seats. Multi-fact data modeling still feels clunky compared with Looker’s semantic layer, native machine learning is an add-on, quarterly server upgrades are labor-intensive, and the mobile experience demands manual layout tweaks.
What key advice would you give to other companies looking to introduce/use the product?
Begin with a high-value, low-complexity use case to build momentum, and invest early in data governance so users trust certified sources. Map license tiers to personas before you sign the contract, establish a small Centre of Excellence to enforce standards, automate DevOps with the Content Migration Tool, and choose Tableau Cloud unless strict data-residency rules force you on-prem.
How would you sum up your experience?
Tableau remains the premium visual analytics workhorse: not the cheapest or easiest to master, but unmatched for exploratory visuals, governed self-service at scale, and an AI roadmap that now sits at the core of Salesforce’s platform strategy.
Role
Project manager for BI/analytics from business department
Number of employees
More than 2.500
Industry
Retail
Source
BARC Panel, The BI & Analytics Survey 26, 05/2025
What do you like best?
I like the interactivity that the software provides and the ability to author new dashboards in a very intuitive way.
What do you like least/what could be improved?
Working with petabyte-scale data stretches the software's capabilities to the limit.
What key advice would you give to other companies looking to introduce/use the product?
Find a good integrator.
How would you sum up your experience?
Positive for the most part, though I still have some doubts about the product's direction under Salesforce ownership.
Role
CIO
Number of employees
More than 2.500
Industry
Retail
Source
BARC Panel, The BI & Analytics Survey 26, 05/2025
What do you like best?
Interface intuitive, visualisations interactives et percutantes, puissance d'analyse, amélioration de la gouvernance des données.
What do you like least/what could be improved?
La gestion des droits d'accès aux données est assez complexe.
What key advice would you give to other companies looking to introduce/use the product?
Bien structurer les données sources, bien assurer la formation des utilisateurs, anticiper la gouvernance des données.
How would you sum up your experience?
Excellente opinion.
Role
Head of a separate BI/analytics organization unit
Number of employees
100 - 2.500
Industry
Banking and finance
Source
BARC Panel, The BI & Analytics Survey 25, 05/2024
What do you like best?
Tableau als Lösung wurde durch die Fachabteilungen gewählt und akzeptiert und wird eigenständig genutzt (Self-Service BI).
What do you like least/what could be improved?
Tableau hat ein unzureichendes Security-Modell, um die Need-to-know-Einschränkungen in der Finanzindustrie hinreichend umsetzen zu können.
What key advice would you give to other companies looking to introduce/use the product?
Anforderungen und Fähigkeiten sollten im Detail erhoben, analysiert und bewertet werden. Tableau ist keine Lösung für alle Probleme und löst bestimmte Aufgaben extrem gut, für andere ist es weniger geeignet. Wenn dies nicht gut analysiert wird, steht man am Ende mit mehreren Tools da, die alle unterhalten werden müssen.
How would you sum up your experience?
Grundsätzlich ist Tableau eine moderne Lösung, die aber sehr auf dem Paradigma beruht, dass es kaum Anforderungen an Abgrenzungen der einzelnen Nutzer im Hinblick auf den jeweiligen Datenkontext gibt. In stark regulierten oder auditierten Bereichen kann dies eine komplexe Herausforderung sein.
Role
Consultant
Number of employees
Less than 100
Industry
Consulting
Source
BARC Panel, The BI & Analytics Survey 25, 03/2024
What do you like best?
One of the things I appreciate most about Tableau is its ease of use for generating and distributing reports. With Tableau's intuitive drag-and-drop interface, even non-technical users can quickly create sophisticated data visualizations and interactive dashboards. The ability to easily combine different views and worksheets into a cohesive story makes it simple to package insights in a way that can be readily shared and understood by others. Tableau's wide range of output options also streamlines the distribution process. Whether publishing to Tableau Server, sharing via email, or embedding visualizations in web pages or documents, distributing reports is straightforward. And with features like subscriptions and alerts, key stakeholders can be automatically notified when new reports are available or data is updated. Overall, Tableau's user-friendly design and robust sharing capabilities empower organizations to unlock insights from their data and effectively disseminate them across teams and departments. The ease of generating visually compelling reports and the flexibility in how they can be distributed is a major strength of the Tableau platform.
What do you like least/what could be improved?
One area where Tableau could be improved is in the intuitive handling and representation of targets, especially for sales and marketing use cases where tracking progress against monthly or weekly goals is fundamental. Currently, adding target lines or values to visualizations in Tableau requires a fair bit of manual effort and data manipulation. There is no streamlined or user-friendly way for managers to simply input their target metrics and have them automatically visualized alongside the actual data. The process typically involves creating separate calculated fields for the targets, potentially joining or blending data sources, and then layering the target values as reference lines or shapes. This can be cumbersome, especially for less technical users just wanting a quick way to overlay targets on top of visualizations. It would be great if Tableau could provide a more seamless, out-of-the-box method for defining and displaying targets across different visualizations. Perhaps a dedicated Target shelf or parameter that allows inputting singular values or ranges that could then be dragged onto views instantly. Enhancing this capability would allow sales and marketing managers to more easily analyze performance against goals without wrestling with data manipulation. The ability to flexibly update and manipulate target representations directly within visualizations would be invaluable.
What key advice would you give to other companies looking to introduce/use the product?
Plan your processes and KPIs in advance: Before rolling out Tableau, take the time to clearly define your key performance indicators (KPIs) and the reporting processes you want to enable. Having a solid understanding of the metrics that matter most to your business will allow you to structure your data sources and Tableau workbooks purposefully from the start. Determine which KPIs need to be tracked at different levels of the organization to avoid rework down the line. Establish a governance method: Implement a governance plan outlining rules and best practices around how Tableau content will be generated, validated, and distributed throughout the company. Define guidelines for areas like data source management, naming conventions, user permissions, standardized calculations, and branding. Having a coherent governance approach will ensure reporting remains consistent, secure, and easy to navigate as usage scales. Build for different user skill levels: When architecting your Tableau environment, account for the varying analytical skills across your user base. Provide some pre-built dashboards and reports for more casual users, while enabling deeper ad-hoc analysis for power users. Leverage appropriate data source design and Tableau features like set analysis and parameters to construct content suited for different audiences. Define a centralized report delivery system: Establish a centralized platform or server environment where finished reports and dashboards can be securely published and accessed. Utilize Tableau's distribution capabilities like subscriptions, alerts, and email reporting to automate scheduled report delivery. Set up folders, projects and permissions to manage access appropriately across teams and level of the organization. Provide training and enable a data-driven culture: Beyond technical implementation, prioritize change management. Invest in training and enablement so employees understand how to leverage Tableau to find and share insights. Nurture a data-driven culture where making decisions based on accurate reporting and visualized data becomes the norm. By proactively planning your reporting processes, governance, user roles, delivery approach and cultural embrace of analytics upfront, you can set your organization up for a smooth and sustainable Tableau deployment that becomes deeply ingrained across teams.
How would you sum up your experience?
My general opinion is that Tableau is an excellent data visualization and business intelligence tool, but I agree with the assessment that it has a relatively small learning curve for basic report delivery, while having a longer learning curve to truly master report generation and leverage Tableau for robust BI capabilities. On the positive side, Tableau's core strength lies in its incredibly intuitive user interface that allows even non-technical users to connect to data sources and quickly start building visualizations with simple drag-and-drop actions. The ability to easily distribute reports and dashboards via Tableau Server or Online makes it great for organizations wanting to make data and insights more accessible. However, as one moves beyond just consuming pre-built content, the learning curve does get steeper to become proficient in advanced report and dashboard authoring. Skills like data preparation, creating proper data models, utilizing calculations, building intricate visualizations, and setting up interactive actions/dashboards require more dedicated training and experience. To truly unlock Tableau's potential for enterprise-grade BI, there are many nuances to understand around data architecture, visual best practices, performance optimization, governance, security, and integrating Tableau into a larger data strategy. Crafting a seamless, robust self-service analytics experience requires well-designed data sources, careful management of content, and adhering to standards. So, in summary, I agree that while Tableau has a very approachable front-end for basic reporting, there is a longer ramp to develop more sophisticated BI skills and harness the full capabilities of the platform across data modeling, analytics, dashboarding, and content management. Having a mix of Tableau power users and consumers is often the key to a successful rollout.
Role
Head of business department
Number of employees
Less than 100
Industry
Media/Publishing
Source
BARC Panel, The BI & Analytics Survey 25, 05/2024
What do you like best?
Visualization capabilities and tie in to data cleaning software. Flexibility in presenting and analyzing data. Good for use with business users and content creators across the board.
What do you like least/what could be improved?
Certain functions are most difficult to implement as a business user with limited coding experience. Certain in depth analyses are difficult.
What key advice would you give to other companies looking to introduce/use the product?
Complete all the training they offer.
How would you sum up your experience?
Great, probably overpriced software.
Role
Employee of a cross-departmental BI/analytics team
Number of employees
More than 2.500
Industry
Transportation and logistics
Source
BARC Panel, The BI & Analytics Survey 25, 04/2024
What do you like best?
Tableau is easy to use and very versatile.
What do you like least/what could be improved?
It’s AI integration with the Tableau Cloud product should be more apparent.
What key advice would you give to other companies looking to introduce/use the product?
Try it out. Find you most capable employees to test the product.
How would you sum up your experience?
The gold-standard of data visualization.
Role
Head of a separate BI/analytics organization unit
Number of employees
More than 2.500
Industry
Healthcare
Source
BARC Panel, The BI & Analytics Survey 25, 05/2024
What do you like best?
Intuitive, not costly, efficient & effective.
What do you like least/what could be improved?
Scalability and lacks functionality.
What key advice would you give to other companies looking to introduce/use the product?
Be very clear in your objectives. Have realistic expctations.
How would you sum up your experience?
It's a good tool, in general.
Role
CEO
Number of employees
More than 2.500
Industry
Legal
Source
BARC Panel, The BI & Analytics Survey 25, 05/2024
What do you like best?
Clean interface and visualization style.
What do you like least/what could be improved?
Data modeling in the cloud and ability to update data for users. Also, the pace of product innovation.
What key advice would you give to other companies looking to introduce/use the product?
Assess the company's roadmap because it is possible that Power BI may innovate ahead of Tableau.
How would you sum up your experience?
Neutral.
Role
Project manager for BI/analytics from IT
Number of employees
More than 2.500
Industry
Manufacturing
Source
BARC Panel, The BI & Analytics Survey 25, 04/2024
What do you like best?
Interaktivität und Dokumentation.
What do you like least/what could be improved?
Konzept für Multi-Language Support.
What key advice would you give to other companies looking to introduce/use the product?
Erste Use Cases gemeinsam mit Experten umsetzen im Fachbereich, um Fachanwender direkt am Beispiel zu schulen und eine Governance aufzubauen. Diese kann dann skaliert werden auf andere Bereiche.
How would you sum up your experience?
Das Tool bietet was man braucht für Dashboarding, Visual Analytics und Self Service BI & Analytics. Die Hürden beim Einsatz werden schnell organisatorische und keine Tool-bezogenen.
Role
IT employee
Number of employees
More than 2.500
Industry
Healthcare
Source
BARC Panel, The BI & Analytics Survey 25, 05/2024
What do you like best?
Versatily. Easy for consumers.
What do you like least/what could be improved?
Report formatting is from another age.
What key advice would you give to other companies looking to introduce/use the product?
Strong business process of who can create / comsume / managed contents.
How would you sum up your experience?
Great BI company, worry of the innovation pace since its aquisition.
Role
Consultant
Number of employees
Less than 100
Industry
Consulting
Source
BARC Panel, The BI & Analytics Survey 25, 05/2024
What do you like best?
The relatively flat learning curve, intuitive UI.
What do you like least/what could be improved?
Cannot think of anything.
What key advice would you give to other companies looking to introduce/use the product?
Take it for a trial run and ask some questions in the user community - they are active and very enthusiastic.
How would you sum up your experience?
Great tool built with visualization and understand the data, not the tech in mind.
Survey Information
Number of reviews for Salesforce Tableau
33
Reviewed versions
Peer groups in the survey
Large/Enterprise-Wide Implementations, Report & Dashboard Focus, Analysis Focus, International BI Giants

