IBM Planning Analytics
What is IBM Planning Analytics?
Flexibile platform for business power users to create tailored planning, budgeting and forecasting as well as analytics applications based on a high-performance and scalable in-memory database. Comprehensive functionality for preparing individual content in Excel and publishing it to the web.
About IBM Planning Analytics
Self-description of the vendor
Would you like to find out more about BARC reviews? Our FAQs answer the most important questions.
IBM Planning Analytics BARC Review & Rating
Provider and product description
IBM is one of the world’s largest providers of IT hardware, software and services. The company has over 280,000 employees worldwide and operates in more than 170 countries.
IBM offers a comprehensive portfolio of analytics, performance management and advanced analytics solutions. Key offerings include IBM Cognos Analytics (for BI and analytics) and IBM Planning Analytics (for planning, budgeting and forecasting). For financial consolidation, close and regulatory reporting, IBM Controller is part of the performance management portfolio. IBM supports a wide range of deployment options, offering cloud, on-premises and containerized applications.
IBM Planning Analytics – the vendor’s strategic enterprise planning product – is a core element of the IBM performance management portfolio and has been on the market since the 1980s. It is a strategic product for IBM because of its rich planning and OLAP analysis capabilities and its underlying in-memory TM1 technology. IBM Planning Analytics is available in both cloud (using IBM Cloud, Amazon Web Services or Microsoft Azure) and on-premises versions and thousands of solutions have been implemented worldwide. At its core, IBM Planning Analytics is a high-performance, multidimensional, in-memory database for budgeting, planning and forecasting with Excel and web front ends. The product is targeted at business power users to enable them to build all types of applications (planning, analysis, strategy management, etc.). Therefore, it does not have a dominant focus on any one topic (finance, sales, HR, etc.) or industry. While the strength of IBM Planning Analytics’ strength lies in its rich flexibility to implement tailored solutions for specific use cases, IBM, and in particular its extensive partner network, provides prebuilt business content for specific use cases and industries. In the latest releases of Planning Analytics, IBM has focused on improving the product’s web client with a modernized user interface and user experience, enhanced charting and visualization capabilities, a web-based data modeling environment, and enhanced planning and workflow capabilities. To control planning processes, a web-based visual workflow designer helps users develop custom workflows (e.g., task management and due dates, status monitoring, approvals, email notifications, etc.). Built-in AI and ML capabilities can be used to generate forecasts based on multiple methodologies and detect anomalies or potential data entry errors. A new IBM Planning Analytics Assistant provides natural language assistance and generative AI insights. In addition, IBM Planning Analytics can be integrated with the services of other IBM technologies such as IBM watsonx for advanced AI or IBM ILOG CPLEX for complex optimization tasks.
IBM Controller is a purpose-built financial consolidation and close product for statutory and management consolidation use cases with predefined dimensions, consolidation calculations and a library of prebuilt reports for data review, system configuration and audit trail. It is industry and organization size agnostic and is available in the cloud and on premises. Standard functionality includes currency translation, intercompany reconciliation/elimination, complex ownership handling, multi-GAAP capabilities and options for custom calculations and flexible reporting. In addition to its 200 built-in standard reports and Microsoft Excel add-in reporting option, it can also integrate with IBM Planning Analytics for OLAP-based reporting and planning.
IBM Cognos Analytics, the vendor’s enterprise BI and analytics platform, delivers enterprise reporting, self-service dashboards and AI-powered analytics in a unified web-based user experience. It combines ease of use with governance capabilities in an end-to-end platform. The product can be deployed in large-scale scenarios to support the needs of many concurrent users and large volumes of data. IBM has integrated automated insights and intent-driven modeling as well as investing in automation and ML capabilities in data modeling, dashboards, data exploration and an analytics chat assistant. The IBM Cognos Analytics Assistant enables users to explore data by asking natural language questions and receiving answers with a presentation-ready dashboard or report.
Strengths and challenges of IBM Planning Analytics
BARC’s viewpoint on the product’s strengths and challenges.
Strengths
- IBM Planning Analytics provides rich flexibility for business power users to create tailored planning, budgeting and forecasting as well as analytics applications based on a high-performance, scalable in-memory database. Comprehensive functionality for preparing custom content in Excel (modeling, custom planning forms, etc.) and publishing it to the web.
- IBM Cognos Analytics combines ease of use with governance capabilities in an end-to-end platform that provides functionality for enterprise reporting, self-service dashboards and AI-powered analytics.
- IBM Controller is a feature-rich and mature financial consolidation and close solution focused on statutory and management consolidation use cases. Currently, IBM is again investing heavily in modernizing IBM Controller with an expanded development team focused on a web client UI/UX refresh, integration capabilities and AI support.
- Well established and growing partner community with global product support and expertise.
Challenges
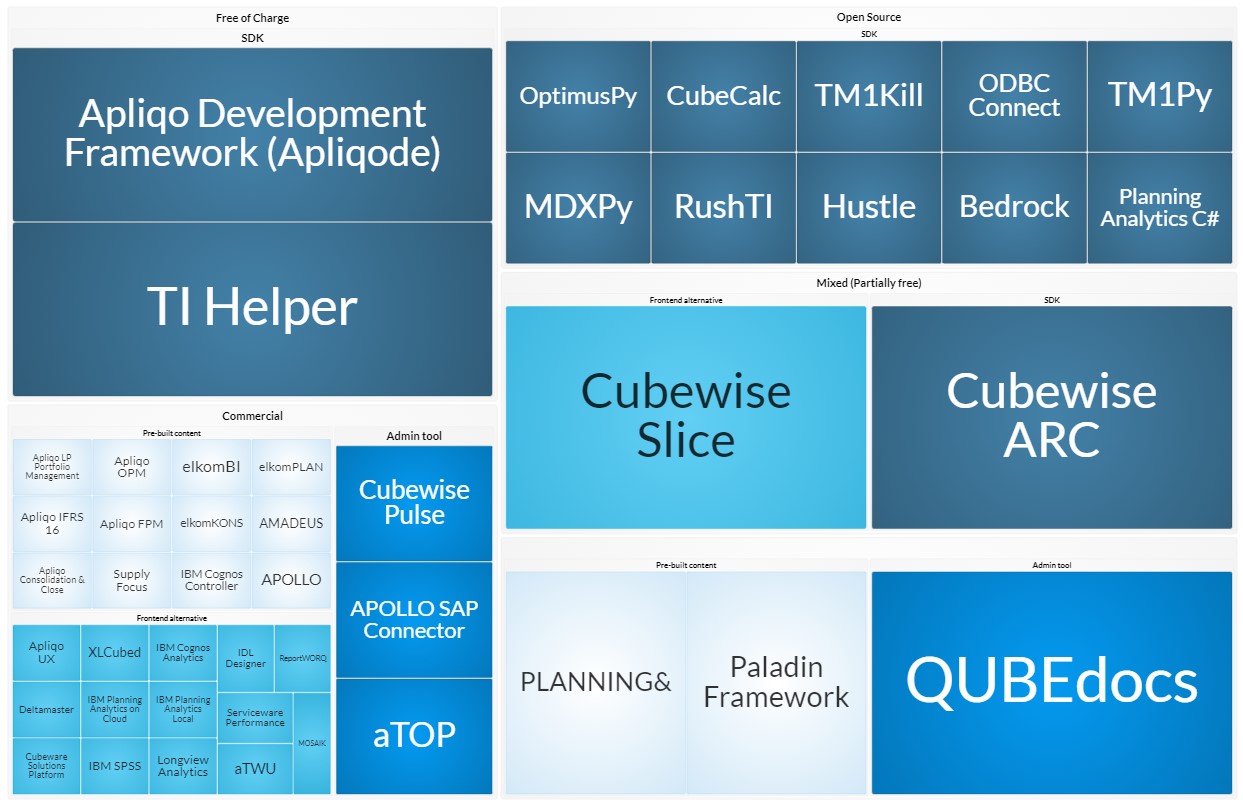
- IBM Planning Analytics is essentially a development environment for planning and OLAP analysis applications. Compared to its competitors, the product has a low level of prefabrication. Limited prebuilt business content is currently available from IBM itself (mainly blueprints and project best practices). However, extensive prebuilt business content is available from partners and IBM now also offers prepackaged solutions for finance, workforce, demand and supply, and projects.
- Compared to competitive products, IBM Planning Analytics for Excel offers limited reporting capabilities (e.g., using Excel’s native formatting and layout features for page-based reports). However, integration with IBM’s enterprise BI and analytics suite (IBM Cognos Analytics) for advanced reporting is available and being enhanced. In addition, IBM continues to expand the reporting capabilities of Planning Analytics, including a new ‘Universal Report’ report type that allows users to create more complex and sophisticated reports.
- When using different IBM performance management and analytics products, users are faced with different user interfaces and user experiences. However, over the past few years, IBM has continued to improve and standardize the UI and UX of its products to provide a more consistent, integrated user experience.
- Comparatively expensive planning and analytics products, although the cloud versions of IBM Cognos Analytics and IBM Planning Analytics offer alternatives for a lower level of initial investment and faster time to value.
IBM Planning Analytics User Reviews & Experiences
The information contained in this section is based on user feedback and actual experience with IBM Planning Analytics.
The information and figures are largely drawn from BARC’s The BI & Analytics Survey, The Planning Survey, The Financial Consolidation Survey and The Data Management Survey. You can find out more about these surveys by clicking on the relevant links.
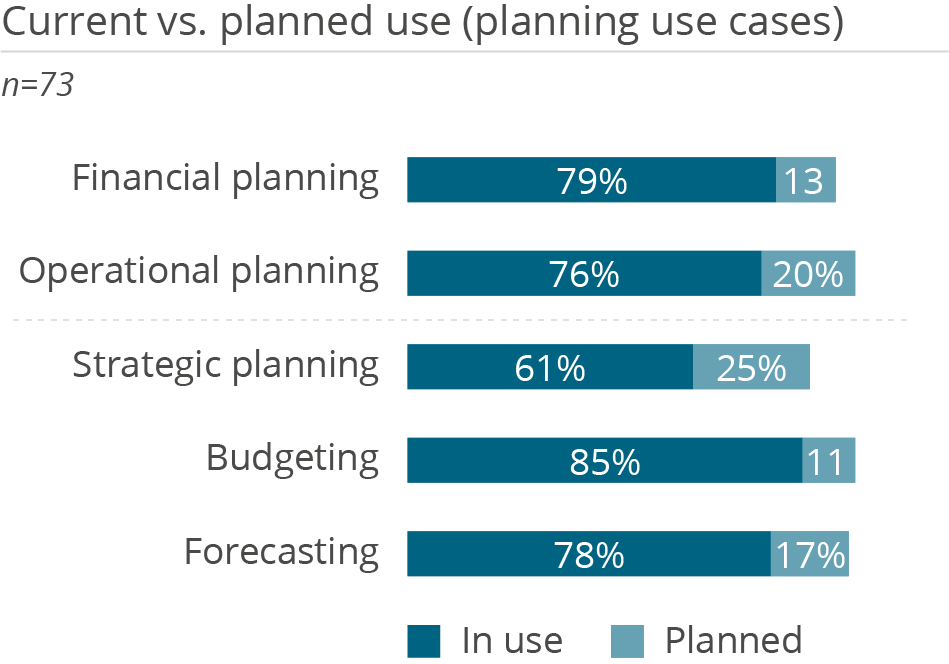
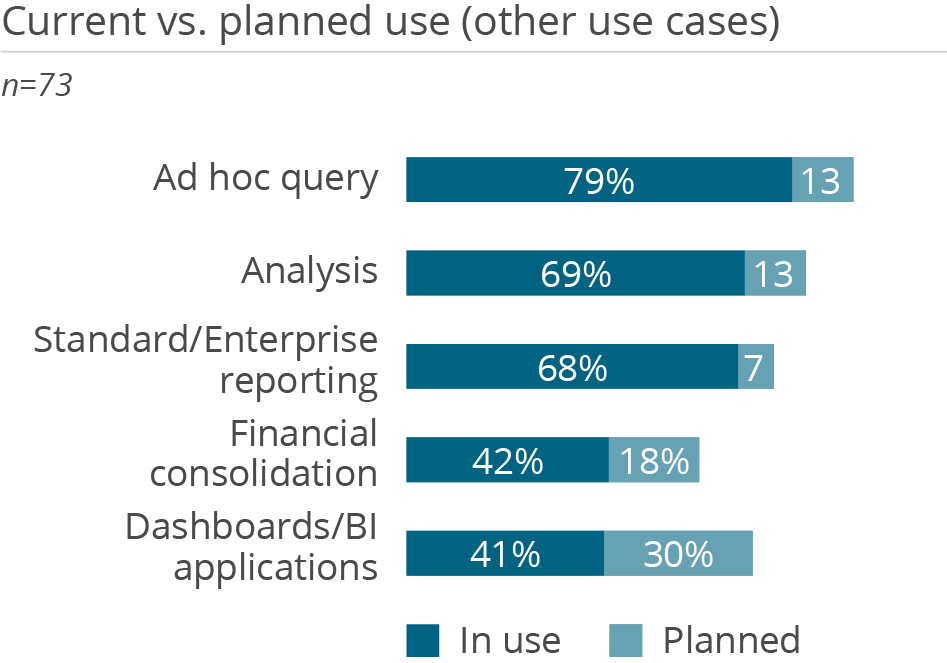
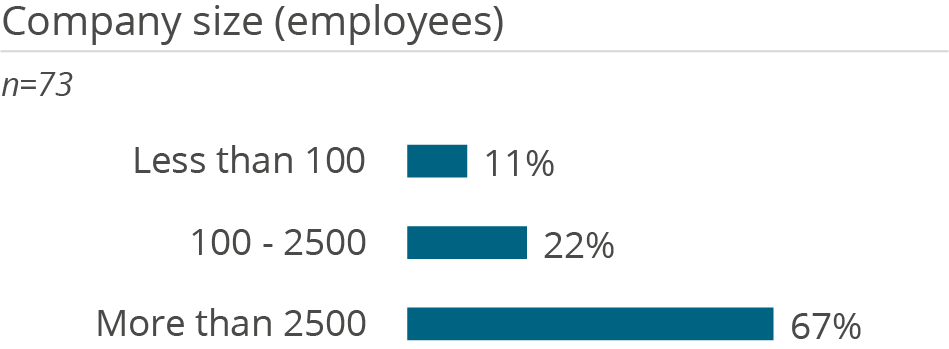
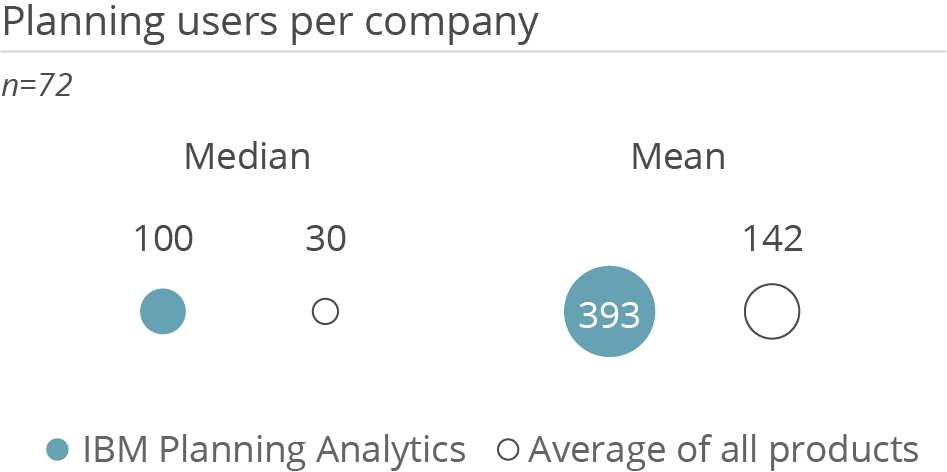
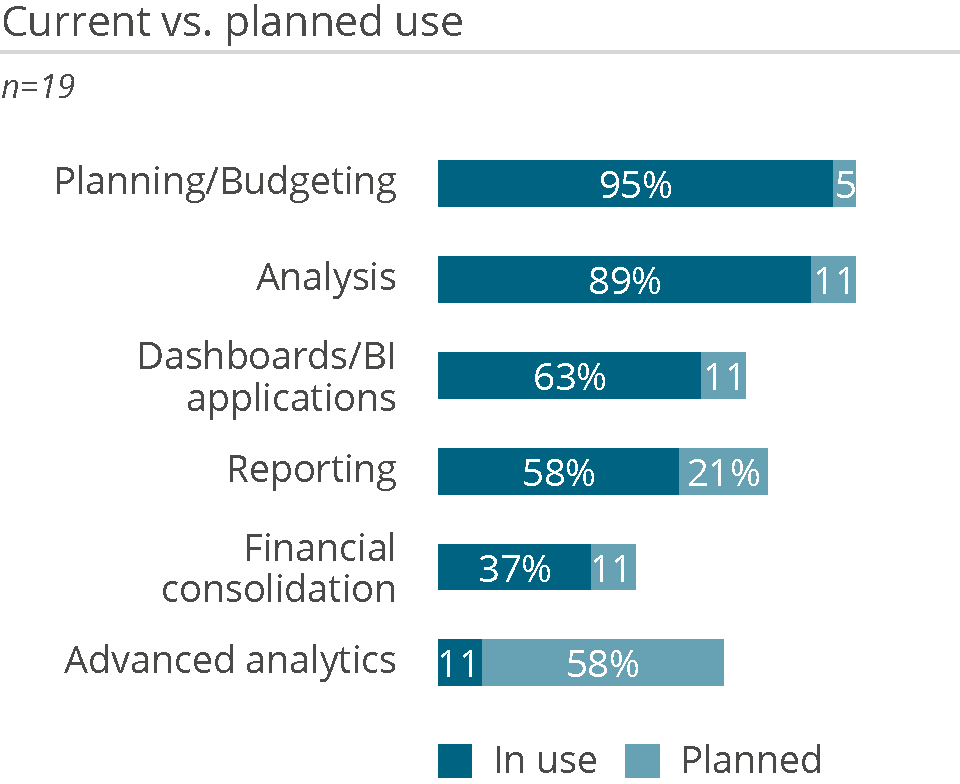
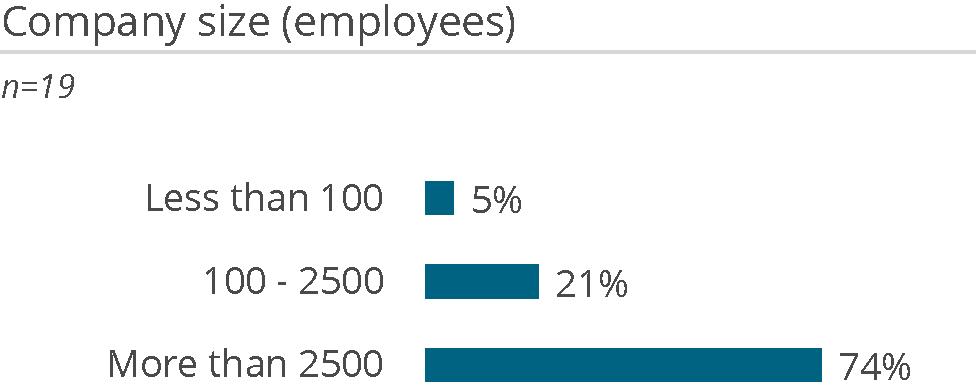
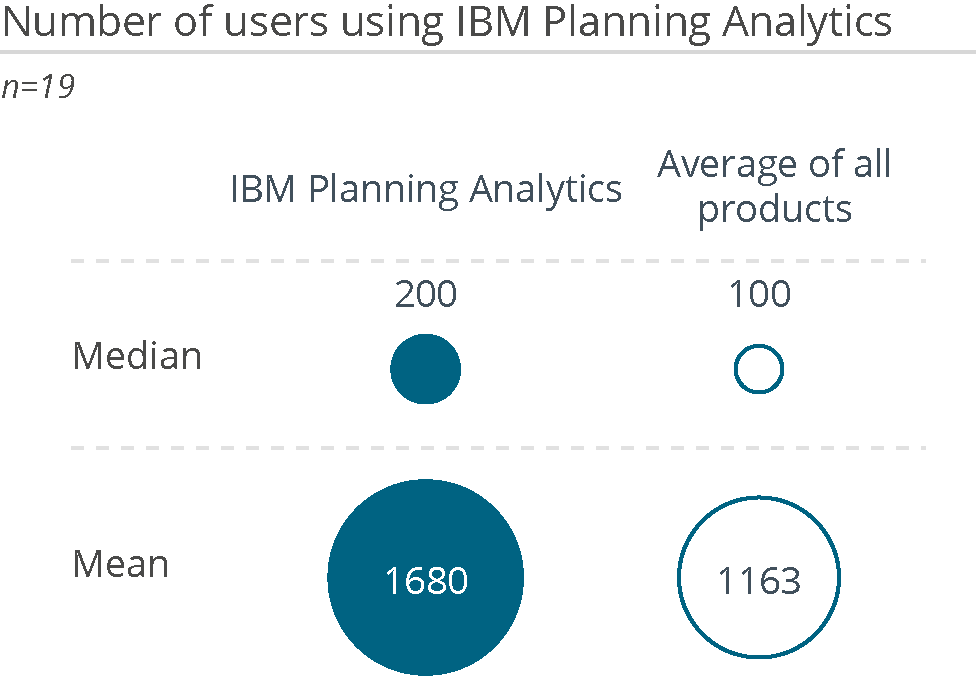
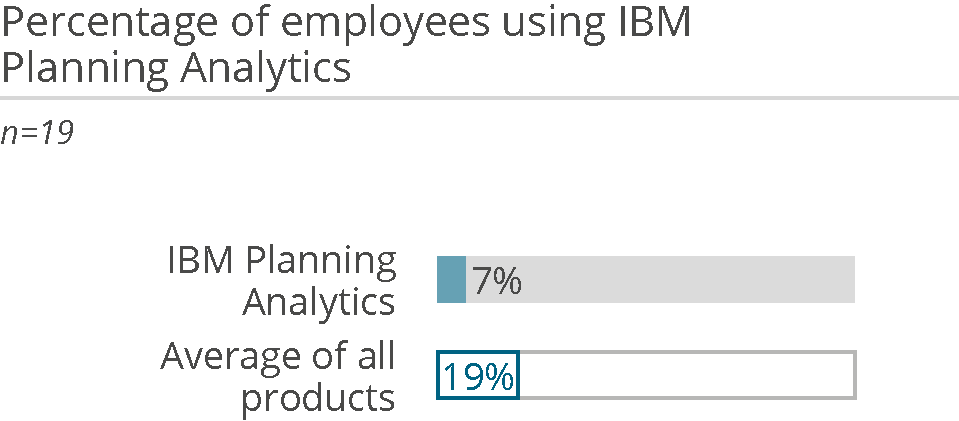
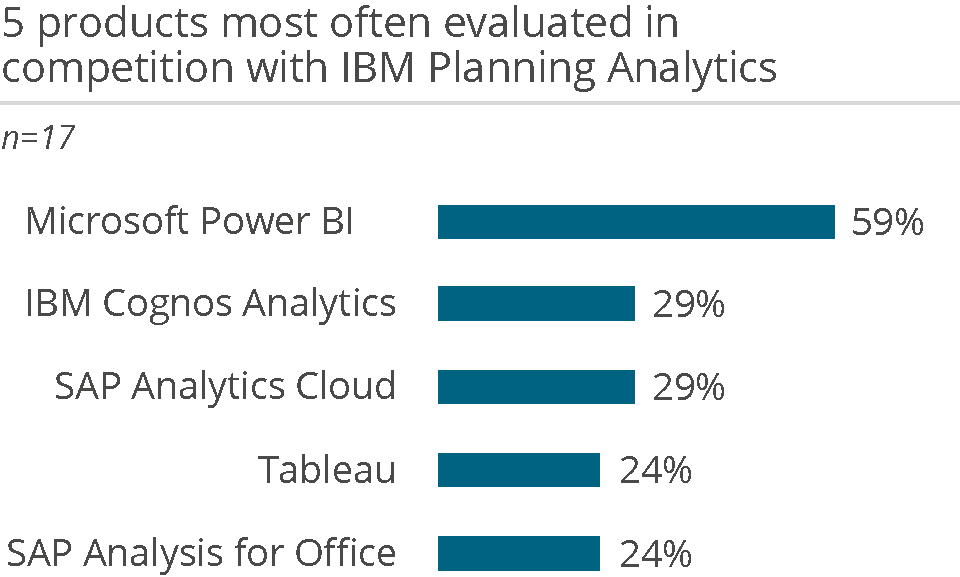
Who uses IBM Planning Analytics in a planning context and how
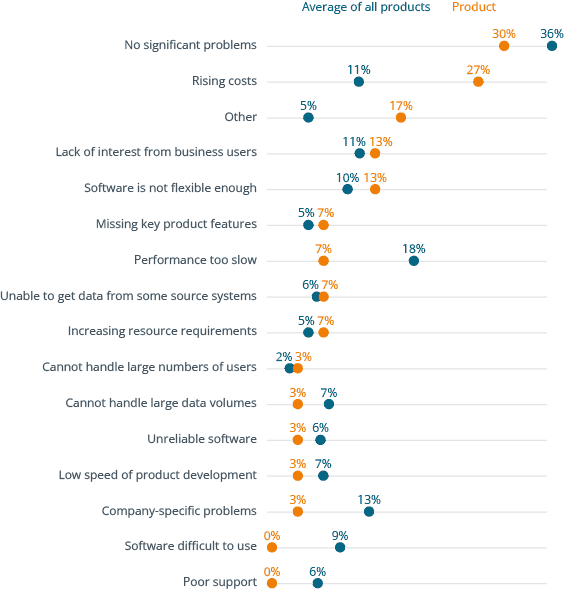
Why users buy IBM Planning Analytics and what problems they have using it
- Get independent information on software solutions, market developments and trends in data, analytics, business intelligence, data science and corporate performance management.
- Make data & analytics decisions based on numbers, data, facts and expert knowledge
- Access to all premium articles and all our research, including all software comparison studies, scores and surveys.
- Unlimited access to the BARC media library
- Consume unlimited content anywhere
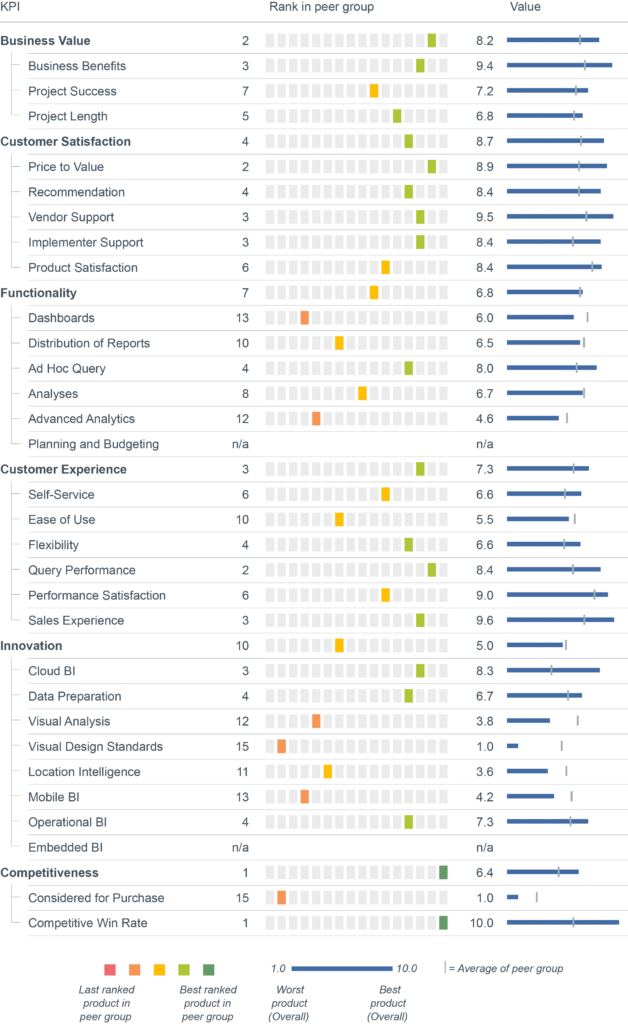
Full user reviews and KPI results for IBM Planning Analytics
All key figures for IBM Planning Analytics at a glance.
- Get independent information on software solutions, market developments and trends in data, analytics, business intelligence, data science and corporate performance management.
- Make data & analytics decisions based on numbers, data, facts and expert knowledge
- Access to all premium articles and all our research, including all software comparison studies, scores and surveys.
- Unlimited access to the BARC media library
- Consume unlimited content anywhere
Individual user reviews for IBM Planning Analytics
Number of employees
Industry
Source
What do you like best?
Hohe und schnelle Datenverfügbarkeit, Ad-hoc-Abfragen, Workspace.
What do you like least/what could be improved?
PAW Dimensionseditor.
What key advice would you give to other companies looking to introduce/use the product?
Es ist eine sehr praktische Software für das Controlling. Man sollte sich gleich zu Beginn Sicherheitslösungen überlegen (z. B. CAM-Authentifizierung).
How would you sum up your experience?
Hohe Kundenzufriedenheit für alle implementierten Lösungen.
Number of employees
Industry
Source
What do you like best?
Flexibilität und Skalierbarkeit.
What do you like least/what could be improved?
Komplizierte Installation.
What key advice would you give to other companies looking to introduce/use the product?
Investieren Sie ausreichend Zeit in das Pflichtenheft.
How would you sum up your experience?
Solides Werkzeug.
Number of employees
Industry
Source
What do you like best?
Dass man sich ein Planungsmodell selbst erstellen kann und dass das Modell flexibel anpassbar ist.
What do you like least/what could be improved?
Bessere Unterstützung von KI- und ML-Modellen.
What key advice would you give to other companies looking to introduce/use the product?
Sich einen guten Implementierer zu suchen.
How would you sum up your experience?
Sehr gutes Produkt, das bei uns schon mehr als zehn Jahre im Einsatz ist. Es wird von IBM gerade auf eine neue Technologie gehoben und sehr stark weiterentwickelt.
Number of employees
Industry
Source
What do you like best?
Hohe Flexibilität und einfache Selbstverwaltung.
What do you like least/what could be improved?
Es ist nicht möglich, Stände abzuspeichern, sondern immer nur den letzten.
What key advice would you give to other companies looking to introduce/use the product?
Gut geeignet für Unternehmen mit vielen Mandanten.
How would you sum up your experience?
Sehr gut.
Number of employees
Industry
Source
What do you like best?
Flexibility and scalability to meet almost any business planning process.
What do you like least/what could be improved?
IBM's documentation is terrible. IBM should focus on product updates that address actual business needs, rather than demoware capabilities. Many times, new features are introduced that demo well but are effectively useless in real-world solutions.
What key advice would you give to other companies looking to introduce/use the product?
Make sure you have in-house staff capable of managing and maintaining the system appropriately. It's not hard to do, but it does take time and effort. Executive support is also crucial.
How would you sum up your experience?
Very positive.
Number of employees
Industry
Source
What do you like best?
Rapport qualité/prix et simplicité du modèle de prix. Possibilité en SaaS, Private Cloud ou même On-Prem (selon le choix des clients). Performances pour gérer de grands volumes de données.
What do you like least/what could be improved?
La data visualisation n'est pas assez propre/stable sur des écrans à définition et taille multiples. L’ETL sans programmation graphique/low code.
What key advice would you give to other companies looking to introduce/use the product?
Se faire aider par des professionnels expérimentés.
How would you sum up your experience?
Très bon.
Number of employees
Industry
Source
What do you like best?
You can copy a past plan and repurpose it for a new plan year.
What do you like least/what could be improved?
You need an IT professional on staff, as it isn't very user-friendly. We can't undo data entry, which is a huge problem if a mistake is made.
What key advice would you give to other companies looking to introduce/use the product?
Make sure you have someone on staff with a background in code writing, who can focus most, if not all, of their time on setting up and maintaining it.
How would you sum up your experience?
It seems more geared toward tech people rather than accountants or numbers people.
Number of employees
Industry
Source
What do you like best?
A structured and well-documented process that helps improve precision and reliability in results.
What do you like least/what could be improved?
Data upload performance.
What key advice would you give to other companies looking to introduce/use the product?
Start with a reasonable scope for the planning domain. Learn from experience and then expand the scope.
How would you sum up your experience?
Excellent product design and unbeatable reactivity from the IBM support team.
Number of employees
Industry
Source
What do you like best?
Flexibilität, Einfachheit, Geschwindigkeit.
What do you like least/what could be improved?
Die Reporting-Funktionalitäten sollten sich am Marktführer messen lassen können. Es gibt Wettbewerber, die besser sind.
What key advice would you give to other companies looking to introduce/use the product?
Know-How im eigenen Unternehmen aufbauen. Guten Implementierungspartner wählen.
How would you sum up your experience?
IBM Planning Analytics ist bei uns eine Erfolgsgeschichte.
Number of employees
Industry
Source
What do you like best?
Die Flexibilität der Software. Man benötigt keinen Entwickler und kein großes Budget, um seine Themen umzusetzen, sondern kann dies in der Fachabteilung selbst schnell erledigen.
What do you like least/what could be improved?
Das neue PAW/PAfE geht in die falsche Richtung. Während die Vorgängerversion Perspective sehr schlank, praktisch, einfach aufgebaut und stark Excel-basiert war, ist die neue Version umständlich, und der PAfE-Client enthält nicht mehr die Admin-Funktionalitäten. Die Dimensionsarbeitsblätter müssten wieder wie früher genutzt werden können. Die Abwärtskompatibilität zu alten Templates ist nicht mehr gegeben. Der neue Client ist sensibel und verursacht häufig Wert-Fehler in den Excel-Abfragen. Im Web-Server könnten weitere Excel-Funktionalitäten integriert werden (aber bitte nicht mit dem PAW, sondern im echten Web-Server).
What key advice would you give to other companies looking to introduce/use the product?
Beim neuen Planning Analytics würde ich erstmal abwarten, ob sich IBM wieder auf den ursprünglichen Gedanken der Software besinnt. Damals ging es darum, eine möglichst flexible, vom Endanwender ad hoc anpassbare Lösung zu schaffen, mit der wir die Zahlen aus den recht statischen Vorsystemen aggregieren, analysieren und weiterverarbeiten können.
How would you sum up your experience?
Ich nutze TM1 seit ca. 24 Jahren und bin grundsätzlich zufrieden, nur die neuen Entwicklungen sind noch nicht ganz ausgereift.
Number of employees
Industry
Source
What do you like best?
V12 looks promising. In terms of performance, if the modeling is done well, the tool offers very good performance.
What do you like least/what could be improved?
Legacy components, OCM, re-modeling, and feeder issues. Poor vendor support.
What key advice would you give to other companies looking to introduce/use the product?
Having a dedicated development team specializing in both technical and financial aspects would be crucial for the efficient use of this tool.
How would you sum up your experience?
7 out of 10. Good tool, well-developed. More powerful than Workday and Anaplan, with a better interface than OneStream. However, the support from IBM is lacking, and many companies are using outdated models that should receive better support from the vendor.
Number of employees
Industry
Source
What do you like best?
Super Performance, einfach zu bedienen, schnelle Ladezeiten und sehr hohe Flexibilität bei der Abbildung von Business-Anforderungen.
What do you like least/what could be improved?
Die Modelle haben einen sehr hohen RAM-Bedarf, was den Cloud-Move aufgrund der hohen Kosten erschwert. Ein Cold-Standby wäre hier wünschenswert. Zudem wäre eine horizontale Skalierung von Vorteil. Es wäre auch wünschenswert, wenn IBM Change Requests schneller angehen würde (oder sie überhaupt berücksichtigen würde).
What key advice would you give to other companies looking to introduce/use the product?
Von Anfang an Gedanken darüber machen, wie das zukünftige Modell aussehen soll. Die Erweiterbarkeit eines bereits manifestierten Modells ist sehr aufwändig.
How would you sum up your experience?
Die User sind sehr zufrieden mit dem Produkt. Es bietet alle notwendigen Funktionalitäten, um die Daten effizient analysieren zu können.
Number of employees
Industry
Source
What do you like best?
Flexibilität bei der Umsetzung von Anforderungen, On-Premise-Verfügbarkeit und Skalierbarkeit.
What do you like least/what could be improved?
Fehlende Basisfunktionen (z. B. Spalten aufklappen, wertbasierte Spaltenfilter, Nullspaltenunterdrückung, Einstellungsmöglichkeiten im UI pro Anwender/Bereich…). Versprechungen werden nicht eingehalten bzw. massiv verzögert (teilweise 1 Jahr oder mehr Wartezeit auf versprochene Verbesserungen/Lösungen durch IBM).
What key advice would you give to other companies looking to introduce/use the product?
Proof of Concept, um die konkreten Anforderungen zu evaluieren. Nicht auf Marketing-Versprechen setzen.
How would you sum up your experience?
Flexible und mächtige Software für Planung, Forecasting, Budgetierung [...], die jedoch unter dem Missmanagement und den leeren Versprechungen des Herstellers leidet.
Number of employees
Industry
Source
What do you like best?
Skalierbarkeit, Flexibilität und Anpassungsfähigkeit, Performance.
What do you like least/what could be improved?
Der multidimensionale Ansatz stellt für viele Nutzer bereits eine Hürde im Verständnis dar.
What key advice would you give to other companies looking to introduce/use the product?
Bringen Sie 2-3 Mitarbeiter in die Lage, die Datenmodelle und Applikationen selbstständig weiterzuentwickeln. Dadurch können Sie das Potenzial von Planning Analytics vollständig ausschöpfen.
How would you sum up your experience?
Spaß!
Number of employees
Industry
Source
What do you like best?
Die Flexibilität. Veränderungen am Planungsmodell sind schnell realisierbar, neue Module können in kurzer Zeit entwickelt und implementiert werden.
What do you like least/what could be improved?
Eine bessere Schnittstelle zu den Vorsystemen, die für uns aber erst bei der Umstellung auf die neue Version verfügbar ist. Es fehlt ein gutes, benutzergeführtes Tool zur Stammdatenpflege. Es sollte erkennbar sein, in welchen Reports/Views/Prozessen die Attribute einer Dimension verwendet werden (z. B. wird diese Information beim Überstreichen angezeigt). Vorschläge/Erinnerungen zur anschließenden Pflege von Subsets wären hilfreich. Der TRASH-Knoten, der beim Löschen von Stammdaten automatisch erzeugt wird, sollte im Subset stets unten und zugeklappt stehen.
What key advice would you give to other companies looking to introduce/use the product?
Mit einem Modul anfangen und dann kontinuierlich ausbauen. Viel Zeit in Tests und den Bau der Reports investieren sowie mehrere Feedbacks aus verschiedenen Regionen einholen (Eingabereports müssen einwandfrei funktionieren, sonst kommt es schnell zur Ablehnung durch die Anwender). Die Konsolidierungsfunktion für IC-Umsatzeliminierung und Zwischenergebniseliminierung sollte von Anfang an mit eingebaut werden.
How would you sum up your experience?
Ich arbeite jetzt schon 9 Jahre mit IBM Planning Analytics und bin insgesamt sehr zufrieden mit dem Tool.
Number of employees
Industry
Source
What do you like best?
Sehr flexible Lösung für den Einsatz in unterschiedlichen Planungsszenarien. Die Verbindung von diversen Plänen ist einfach möglich und es gibt eine sehr gute Individualisierung von Workflows.
What do you like least/what could be improved?
Das UI wirkt immer noch ein bisschen sperrig, wird aber stark weiterentwickelt. Die Priorisierung der Entwicklung ist nicht immer ganz nachvollziehbar und stark auf KI fokussiert.
What key advice would you give to other companies looking to introduce/use the product?
Überlegen Sie sich vorher, ob die notwendige Datengrundlage besteht, und definieren Sie Ihre Prozesse sauber, um klare Entwicklungsvorgaben zu machen. Durch die Flexibilität kann man sich auch verzetteln. Ein guter Implementierungspartner kann hier helfen. Think big, but start small. Lassen Sie sich in einem PoC überzeugen.
How would you sum up your experience?
Sehr gutes Planungstool, dass in die Breite und Tiefe skalieren kann.
Number of employees
Industry
Source
What do you like best?
Struktur der Engine und saubere Trennung zwischen ETL und Fachbereichslogik, hohe Skalierbarkeit, umfangreiche Integration, wenn ausreichend Entwicklerressourcen zur Verfügung stehen (Python, TM1Py + TM1-Know-how).
What do you like least/what could be improved?
Einige Funktionen im PAW-Frontend fehlen, teilweise auf der Roadmap für 2025. Migration der Altlasten (V11 bzw. PA 2.1-Transitionphase) – teilweise hausgemacht.
What key advice would you give to other companies looking to introduce/use the product?
Gutes Requirements Engineering, über den Tellerrand schauen und offen sein für z. B. Datenintegration per tm1py. TM1/PA nicht als Golden Record, sondern als Data Mart verstehen und in die Landschaft integrieren. Bei der Auswahl externer Beratung auf übergreifendes IT/Developer Know-how Wert legen, statt auf Senior Consultants mit V2.0 Best Practices.
How would you sum up your experience?
Starke Performance der Datenbank und Rule Engine mit einem modernen Front-End, dessen Funktionen man auch nutzen sollte.
Number of employees
Industry
Source
What do you like best?
Die komplette Freiheit und Flexibilität in der Gestaltung der Lösung. Die Performance. Das integrierte ETL-Tool Turbo Integrator.
What do you like least/what could be improved?
Im Excel-Add-In Planning Analytics for Excel fehlt eine Bursting-Funktion.
What key advice would you give to other companies looking to introduce/use the product?
Entwickeln Sie Inhouse oder bauen Sie im Zuge der Einführung entsprechende Kapazitäten auf. Die Software eignet sich perfekt für Learning by Doing. Die Entwicklung sollte maßgeblich innerhalb der Fachabteilung durchgeführt werden. Inhouse IT-Entwickler und Fachabteilungen müssen sehr eng abgestimmt vorgehen, damit das Projekt zum Erfolg wird. Fangen Sie einfach an, der weitere Bedarf ergibt sich automatisch aus den erzielten Erfolgen.
How would you sum up your experience?
Das Tool konnte bisher jede Anforderung ohne Probleme abbilden.
Number of employees
Industry
Source
What do you like best?
Flexibilität und Anpassungsfähigkeit, Echtzeit-Datenverarbeitung sowie Automatisierung und Prozesse.
What do you like least/what could be improved?
Komplexität in der Entwicklung und Wartung, begrenzte Out-of-the-Box-Funktionen sowie Verbesserungsmöglichkeiten bei den Visualisierungstools und der Benutzerfreundlichkeit.
What key advice would you give to other companies looking to introduce/use the product?
Klare Ziele und Anforderungen definieren, Dimensionen und Modelle sorgfältig planen, den Fokus auf Datenqualität legen und die zukünftige Skalierbarkeit berücksichtigen.
How would you sum up your experience?
Meine Erfahrung mit IBM Planning Analytics lässt sich als eine Kombination aus Leistungsstärke, Flexibilität und Komplexität beschreiben. Es ist ein äußerst vielseitiges Werkzeug, das in den richtigen Händen sehr mächtig ist, jedoch auch Herausforderungen mit sich bringt.
Number of employees
Industry
Source
What do you like best?
Große Flexibilität, hohe Geschwindigkeit.
What do you like least/what could be improved?
Fehlende Schnittstellen zu Vorsystemen (inkl. Drill-Through), Admin-Tools könnten weiterentwickelt werden, fehlende automatische Feeder-Berechnung, Debugger im Sandbox-Modus ohne Blockieren von Prozessen, Prozesse behindern sich gegenseitig und lassen sich nicht immer löschen (z. B. bei Wait), fehlende Audit-Fähigkeit.
What key advice would you give to other companies looking to introduce/use the product?
Minimieren oder Vermeiden von rule-basierten Berechnungen.
How would you sum up your experience?
TM1 besticht durch seine große Flexibilität und hohe Geschwindigkeit. Erweiterungen lassen sich häufig mit wenig Entwicklungsaufwand realisieren. Auch riesige Datenmengen und Dimensionen können problemlos umgesetzt werden.
Number of employees
Industry
Source
What do you like best?
Die Abfrage Geschwindigkeit und die Flexibilität in der Modellierung.
What do you like least/what could be improved?
-
What key advice would you give to other companies looking to introduce/use the product?
Zuerst den Standard definieren, dann erst implementieren.
How would you sum up your experience?
Sehr gutes Tool für Fachabteilungen, die wissen was sie wollen.
Number of employees
Industry
Source
What do you like best?
Mir gefallen besonders gut, dass man die Datenmodelle so flexibel designen kann und über die Echtzeitberechnung der Rechenregeln schnelle und flexible Planungsanwendungen und Dashboards bauen kann.
What do you like least/what could be improved?
Die Frontends wirken manchmal etwas altbacken
What key advice would you give to other companies looking to introduce/use the product?
Bei aller Flexibilität der Software sollten die Anforderungen der Fachabteilungen klar sein. Es müssen genug Ressourcen der Fachanwender bei der Definition der Anforderungen, Test, Schulungen etc... eingeplant werden.
How would you sum up your experience?
Sehr gute Perfomance und flexible Datenmodelle.
Number of employees
Industry
Source
What do you like best?
Very flexible and powerful data platform TM1.
What do you like least/what could be improved?
Newer frontends aren't fully integrated with TM1 Server anymore (e.g. separate user maintenance).
What key advice would you give to other companies looking to introduce/use the product?
Build up well-grounded inhouse knowledge.
How would you sum up your experience?
One of the most powerful pieces of software.
Number of employees
Industry
Source
What do you like best?
Excel Add-in. Performance bei komplexen Berechnungen. Flexibilität.
What do you like least/what could be improved?
Automatische Berichtsverteilung.
What key advice would you give to other companies looking to introduce/use the product?
Zusatzmodul oder -tool für Berichtsverteilung. Relationale Datenbank für Data Staging als Vorsystem.
How would you sum up your experience?
Sehr positiv. Super flexibles System, das auf nahezu alle Bedürfnisse bzgl. BI angepasst werden kann.
Number of employees
Industry
Source
What do you like best?
Flexibilität und schnelle Umsetzung.
What do you like least/what could be improved?
Direkte Schnittstellen zu SAP ERP und Power BI.
What key advice would you give to other companies looking to introduce/use the product?
Eine gute Wahl im Vergleich und anderen Lösungen auf dem Markt. Kann ohne IT Support auch nur vom Fachbereich aufgesetzt werden.
How would you sum up your experience?
Nach 15 Jahren Erfahrung mit BI Tools immer noch meine erste Wahl.
Number of employees
Industry
Source
What do you like best?
Die hohe Flexibilität im Modell. Das neue Planning Analytics Workspace. Die Weiterentwicklung des Produkts.
What do you like least/what could be improved?
Die hohen Kosten für Lizenzen und Wartung.
What key advice would you give to other companies looking to introduce/use the product?
Wenn ihr Flexibilität wollt, nutzt das IBM Planning Analytics. Es kann für das gesamte Unternehmen genutzt werden.
How would you sum up your experience?
12 Jahre Erfahrung in der Datenmodellierung und Berichtserstellung waren sehr positiv.
Number of employees
Industry
Source
What do you like best?
Ständige Innovation, gute Excel-Integration und Webanwendung.
What do you like least/what could be improved?
Vollständige Integration aller Funktionen in Planning Analytics Workspace notwendig (aktuell 2 Welten).
What key advice would you give to other companies looking to introduce/use the product?
Direkt den Workspace und Planning Analytics for Excel nutzen und nicht die ursprüngliche Software (Architect, Perspectives).
How would you sum up your experience?
Anfängliche Schwierigkeiten aufgrund fehlender Funktionalität in der neuen Welt, mittlerweile eine sehr integrierte Planung.
Number of employees
Industry
Source
What do you like best?
Kern-Datenbank TM1.
What do you like least/what could be improved?
Von IBM entwickelte Benutzeroberfläche weicht stark von der den Entwicklern bekannten TM1-Benutzeroberfläche Perspectives ab.
What key advice would you give to other companies looking to introduce/use the product?
–
How would you sum up your experience?
Ein sehr gutes flexibles OLAP-Instrumentarium mit der Super-TM1-Datenbank. Aber seit IBM-Übernahme nicht mehr so intuitive Benutzerumgebung und leider mit häufigen Updates, weil noch in fortwährender Weiterentwicklung.
Number of employees
Industry
Source
What do you like best?
I strongly recommend this product. Planning Analytics added significant efficiencies and improvements to our budgeting and planning processes. Flexibility, scalability, and tight integration with Excel are key strengths, as well as user friendly Excel interface in Pafe (Planning Analytics for Excel) and good dashboarding functionality in Planning Analytics Workspace.
What do you like least/what could be improved?
–
What key advice would you give to other companies looking to introduce/use the product?
–
How would you sum up your experience?
I would strongly recommend this product. It is a great tool, as evidenced by its flexibility, ease of use, and strong integration with Excel.
Number of employees
Industry
Source
What do you like best?
Flexibility with ability to combine online and offline calculations. Predictive analytics feature looks promising.
What do you like least/what could be improved?
Cost of upgrade should be stabilized.
What key advice would you give to other companies looking to introduce/use the product?
Take advantage of AI to infuse more automation.
How would you sum up your experience?
The product keeps its promises.
Number of employees
Industry
Source
What do you like best?
Anpassungsfähigkeit der Software an den jährlichen Anforderungen im Fachbereich. Flexibilität. Verknüpfung mit Excel.
What do you like least/what could be improved?
Priorisierung der Cloud-Entwicklung.
What key advice would you give to other companies looking to introduce/use the product?
Jedes Unternehmen ist individuell, daher braucht es auch größtmögliche Flexibilität im Planungsprozess mit einer geeigneten Software. Fachbereich in dieser Hinsicht fördern.
How would you sum up your experience?
Langjährige Nutzung und trotzdem am Pulse der Zeit.
Number of employees
Industry
Source
What do you like best?
Speed, scalability, and flexibility to handle most any type of planning and forecasting situation.
What do you like least/what could be improved?
User interface.
What key advice would you give to other companies looking to introduce/use the product?
Put it on your short list. Complete a real world competitive bake off with your data, with your internal technical people involved not just implementations consultant people. You will learn a lot more about product features and flexibility and total cost of ownership by having your team intimately engaged in the process.
How would you sum up your experience?
Very positive. We’ve been able to accommodate many types of applications with the tool kit even outside standard financial planning and budgeting.
Number of employees
Industry
Source
What do you like best?
Outstanding TM1 Database with functional Database concept. This makes the difference.
What do you like least/what could be improved?
Large variety of legacy frontends, which each have its own strength, but full merge into latest frontend generation is still missing.
What key advice would you give to other companies looking to introduce/use the product?
Build up inhouse knowledge to fully leverage all usage options of this outstanding piece of software.
How would you sum up your experience?
I haven't come across a data/analytics problem, that I couldn't solve using IBM Planning Analytics/TM1.
Number of employees
Industry
Source
What do you like best?
Einfach, generisch. Write back von Kreuztaballen. Stabilität.
What do you like least/what could be improved?
Keine relationale Datenbank (mit einfacher Schnittstelle). Rules und Feeders.
What key advice would you give to other companies looking to introduce/use the product?
Referenzbesuch bei vergleichbarer Firma.
How would you sum up your experience?
Die User lieben und schätzen die Applikation.
Number of employees
Industry
Source
What do you like best?
Sehr flexibel in Abbildung von Business-Prozessen. Hohe Performance auch bei außergewöhnlich großen Modellen. Sehr mächtig mit der Möglichkeit von Live-Links in der Form von Rules.
What do you like least/what could be improved?
Weiterentwicklungswünsche könnten besser berücksichtigt werden. (z.B. Renaming von Dimensionselement / Cubes / Instanzen).
What key advice would you give to other companies looking to introduce/use the product?
Die Architektur der Cubes mit deren Dimensionalitäten wohlüberlegt zu Beginn zu machen, da spätere Anpassungen aufwändig sind.
How would you sum up your experience?
Ein tolles Tool, das sehr viel Flexibilität bietet und nicht mehr wegzudenken wäre.
Number of employees
Industry
Source
What do you like best?
Sehr flexibel einsetzbar, ich habe noch keinen Anwendungsfall gefunden, der nicht umsetzbar wäre. Besonders in Kombination mit Cognos Analytics entfaltet PA seine Möglichkeiten.
What do you like least/what could be improved?
Lizenzen sind relativ teuer.
What key advice would you give to other companies looking to introduce/use the product?
Macht euch im Vorwege klar, wer planen soll.
How would you sum up your experience?
Seit vielen Jahren sehr zufrieden.
Number of employees
Industry
Source
What do you like best?
Serves planning at the lowest level and the ability to consolidate at different levels and the ability to report at the planned level. Flexible to customize and use, low learning curve.
What do you like least/what could be improved?
Nothing as such.
What key advice would you give to other companies looking to introduce/use the product?
have a clear use case, try out the tool for the use case on hand especially in the areas of ease of implementation/use/administration, flexibility to customize, training and have user involvement right through the evaluation and implementation process.
How would you sum up your experience?
Great tool for planning and consolidation of planning across the enterprise.
Number of employees
Industry
Source
What do you like best?
Skalierbarkeit technisch (Datenmenge) und fachlich (Offenheit bzgl. Datenmodellen und Regeln/Berechnungen).
What do you like least/what could be improved?
Versionswechsel von alter Architektur zur neuen Architektur noch unklar für on-prem Installationen.
What key advice would you give to other companies looking to introduce/use the product?
Starten sie mit einem kleinen Modell, um Erfahrungen zu sammeln, evtl. auch mit Hilfe eines Experten. Wachsen Sie dann mit ihren Modellen und fachlichen Anforderungen.
How would you sum up your experience?
Die Anwender lieben es.
Number of employees
Industry
Source
What do you like best?
Flexibilität / logischer Aufbau.
What do you like least/what could be improved?
Alle Funktionen des Architekten in PAW verfügbar machen. Multiple Selection beim List Selector Widget ermöglichen.
What key advice would you give to other companies looking to introduce/use the product?
Zeit in die Entwicklung der Cube Architektur investieren. Reporting Masken / Spreadsheets erst am Ende entwickeln.
How would you sum up your experience?
Sehr gut.
Number of employees
Industry
Source
What do you like best?
Die Flexibilität, Vielseitigkeit und phenomänale Softwarelandschaft durch Drittanbieter - somit bleibt nichts unmöglich. Die hohe Skalierbarkeit und Robustheit.
What do you like least/what could be improved?
Monatliche Updates bringen mich durcheinander, aber machen auch Spaß in der Arbeit mit Web-Clients.
What key advice would you give to other companies looking to introduce/use the product?
Eine Unternehmenslizens.
How would you sum up your experience?
Alles in Allem sehr gute Erfahrungen!
