Tool for preparing, analyzing and visualizing data; optional provision of models and analyses via SQL Server or Azure; part of the Microsoft Office package.
BARC studies, events and webinars with this vendor
Microsoft Excel BARC Review & Rating
Provider and product description
Microsoft, the world’s largest software company, was founded in 1975 and has become a household name primarily due to its Windows operating system and Office suite. With its offerings, Microsoft wants to contribute to a modern workspace for its customers, whether they are private individuals or large enterprises. The vendor has a broad enterprise offering, ranging from cloud (Azure) to database to its ERP products.
Microsoft was among the first vendors to focus on providing cloud-based solutions for analytics, a path later followed by several competitors. Azure is used by numerous companies as a cloud computing platform and for storing substantial amounts of data, putting Microsoft in a good position to offer integrated analytics front ends. Indeed, the vendor has not only integrated Power BI, its core BI & analytics platform, with many Azure Services and Microsoft products but has also included it in various product packages. One of the most recent is Microsoft Fabric, designed as an integrated end-to-end data and analytics platform delivered as Software as a Service (SaaS). The package contains several Azure services such as Power BI, Azure Synapse Analytics, Azure Data Factory and many more. The core value proposition and advantage for customers is that the already stitched together services facilitate the building up of a SaaS environment consisting of data and analytics services. One of the additional benefits is the obligatory Data Lake ‘OneLake’, which is automatically connected with all other Fabric services and can be used by customers without extra configuration.
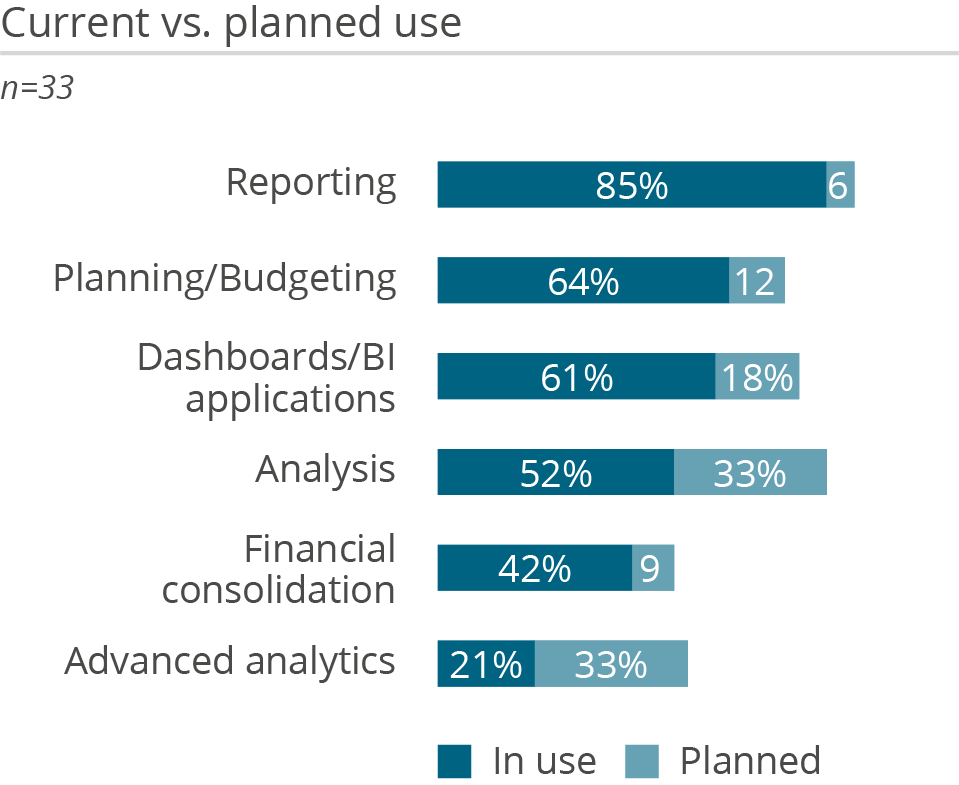
Microsoft Excel – part of the Microsoft 365 suite – provides a range of functions catering to the needs of business intelligence and analytics professionals. Among these, the Power Query integration enables users to import, transform and cleanse data from various sources. Power Pivot lets users create data models, establish relationships between tables and perform advanced calculations using Data Analysis Expressions (DAX). PivotTables and PivotCharts are available for data analysis, allowing users to summarize data and visualize trends. Excel also offers advanced analytical capabilities through Solver, which addresses complex optimization and simulation scenarios. Moreover, Excel’s graphical functionality supports the creation of dashboards. However, in practice, Excel is most commonly used for data management tasks, detailed analysis and reporting in pure Excel tables.
Microsoft was among the first vendors to focus on providing cloud-based solutions for analytics, a path later followed by several competitors. Nowadays, Microsoft 365 is used by numerous companies in the cloud.
This product review describes the analysis product Excel. Microsoft Fabric (Power BI) is covered separately in The BI & Analytics Survey 26.
Strengths and challenges of Microsoft Excel
BARC’s viewpoint on the product’s strengths and challenges.
Strengths
Excel is well known and widely used – probably more widely than any other BI tool.
Users are (or become quickly) familiar with the GUI.
Competencies and partners are available worldwide.
Companies with existing enterprise agreements do not incur additional licensing fees.
Easy collaboration through sending of Excel files and publishing them to other Microsoft products.
Web and mobile clients with Office 365 available with improved co-working capabilities.
Challenges
Integration with other Microsoft products is at data level only and lacks a central metadata repository.
Limitations in terms of handling large data volumes.
Due to its limited security functionality, the ease with which files can be sent by email or published in Sharepoint makes it very hard to govern the data.
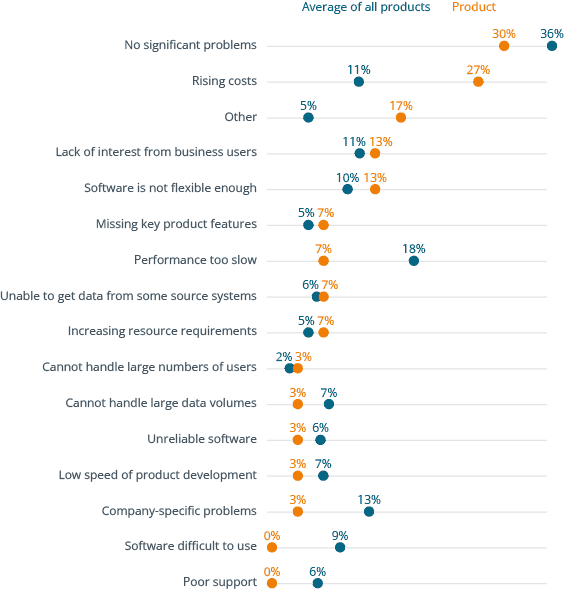
Why users buy Microsoft Excel and what problems they have using it
Premium content. Unlock with BARC+.
For just €79 per month (€948 per year) you can access all the paid content on www.barc.com.
Your benefits:
Get independent information on software solutions, market developments and trends in data, analytics, business intelligence, data science and corporate performance management.
Make data & analytics decisions based on numbers, data, facts and expert knowledge
Access to all premium articles and all our research, including all software comparison studies, scores and surveys.
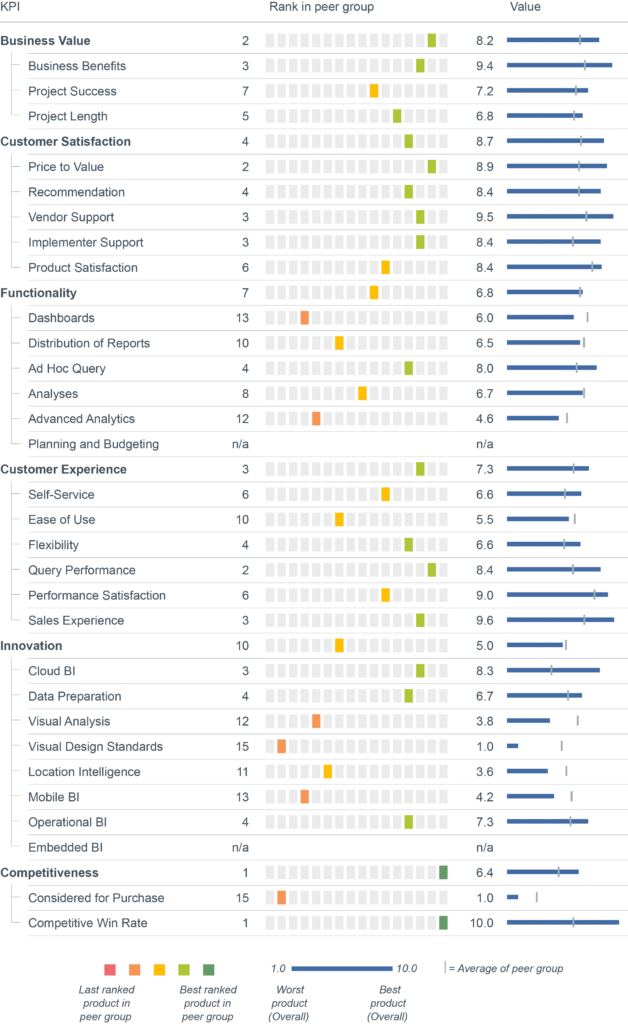
Full user reviews and KPI results for Microsoft Excel
All key figures for Microsoft Excel at a glance.
Premium content. Unlock with BARC+.
For just €79 per month (€948 per year) you can access all the paid content on www.barc.com.
Your benefits:
Get independent information on software solutions, market developments and trends in data, analytics, business intelligence, data science and corporate performance management.
Make data & analytics decisions based on numbers, data, facts and expert knowledge
Access to all premium articles and all our research, including all software comparison studies, scores and surveys.
User familiarity with the base product means a lot of self-service manageability.
What do you like least/what could be improved?
Large data sources can prove problematic. Connecting through Open Data Protocol (OData) seems very slow.
What key advice would you give to other companies looking to introduce/use the product?
Worth a look for SME (small and medium-sized enterprises) businesses wanting to introduce BI practices, given the pricing model and scalability.
How would you sum up your experience?
I have worked with Excel specifically for years, and it has improved with Power Pivot / Power BI capabilities. It is most useful as almost all end users, internal and external, are familiar with Excel.
Role
Consultant
Number of employees
More than 2.500
Industry
Public sector
Source
BARC Panel, The BI & Analytics Survey 26, 03/2025
What do you like best?
Familiarity.
What do you like least/what could be improved?
Development of functionality.
What key advice would you give to other companies looking to introduce/use the product?
Use Power Pivot within Microsoft Excel.
How would you sum up your experience?
Fair enough.
Role
Project manager for BI/analytics from business department
Number of employees
Less than 100
Industry
Retail
Source
BARC Panel, The BI & Analytics Survey 26, 04/2025
What do you like best?
Cheap and easy.
What do you like least/what could be improved?
Cannot handle big data.
What key advice would you give to other companies looking to introduce/use the product?
Know the limitation.
How would you sum up your experience?
Okay.
Role
Project manager for BI/analytics from business department
Number of employees
100 - 2.500
Industry
Banking and finance
Source
BARC Panel, The BI & Analytics Survey 26, 05/2025
What do you like best?
Flexibility and user-friendliness.
What do you like least/what could be improved?
Difficult to govern.
What key advice would you give to other companies looking to introduce/use the product?
Weigh governance considerations from the beginning.
How would you sum up your experience?
Ok as corporate solution.
Role
CIO
Number of employees
Less than 100
Industry
Insurance
Source
BARC Panel, The BI & Analytics Survey 25, 06/2024
What do you like best?
Users are already familiar with the tool, so onboarding is easy. Quick performance.
What do you like least/what could be improved?
Unresolved bugs, and it's hard to report those bugs.
What key advice would you give to other companies looking to introduce/use the product?
Consider Power BI.
How would you sum up your experience?
Mostly positive, but bugs should be addressed quickly.
Role
Consultant
Number of employees
Less than 100
Industry
Education
Source
BARC Panel, The BI & Analytics Survey 25, 04/2024
What do you like best?
Power Pivot seamlessly integrates with Excel, providing users with familiar tools and interfaces for data analysis and visualization. This integration makes it easy for Excel users to leverage the advanced data modeling and analysis capabilities of Power Pivot without having to learn new software.
What do you like least/what could be improved?
While Excel provides various charting and visualization tools, some users may find the built-in options limited compared to dedicated data visualization software. Enhancing Excel's visualization capabilities, particularly for creating interactive and advanced visualizations, could improve its utility for data analysis and presentation.
What key advice would you give to other companies looking to introduce/use the product?
Keep an eye on the performance and scalability of Excel, especially when working with large datasets or complex Power Pivot models. Monitor system resources, such as memory and processing power, and optimize models and calculations as needed to ensure smooth performance.
How would you sum up your experience?
My general opinion of Microsoft Excel, including Power Pivot, is quite positive. Excel has long been a staple tool for data analysis, spreadsheet management, and visualization, and its versatility makes it suitable for a wide range of users, from individuals to large organizations.
Role
Head of business department
Number of employees
Less than 100
Industry
Education
Source
BARC Panel, The BI & Analytics Survey 25, 05/2024
What do you like best?
Ease of use and flexibility.
What do you like least/what could be improved?
Lacking standard automated tools and options.
What key advice would you give to other companies looking to introduce/use the product?
Make sure users are well versed in Excel and it's use.
How would you sum up your experience?
Very good product with a lot of flexibility, sometimes a bit hard to get things done fast.
Role
Head of business department
Number of employees
More than 2.500
Industry
Banking and finance
Source
BARC Panel, The BI & Analytics Survey 25, 05/2024
What do you like best?
Flexibilität.
What do you like least/what could be improved?
Datenhaltung wenig brauchbar.
What key advice would you give to other companies looking to introduce/use the product?
Einige weinige Personen als Experten ausbilden.
How would you sum up your experience?
Schnell umsetzbar.
Role
Project manager for BI/analytics from business department
Number of employees
100 - 2.500
Industry
Social
Source
Invited by the vendor, The BI & Analytics Survey 25, 04/2024
What do you like best?
Est aujourd'hui la clé de nos métiers. Sans Microsoft Excel, nous ne pourrions pas accomplir la moitié de notre activité dans notre direction.
What do you like least/what could be improved?
Il s'agit d'une solution qui s'est imposée dans le monde de l'entreprise. Il existe pourtant d'autres solutions tout aussi viable et multi-tâches. Les mises à jour apportent des modifications qu'il faudrait mieux présenter pour guider les utilisateurs (une option peut être déplacer dans un autre menu ou être remplacée).
What key advice would you give to other companies looking to introduce/use the product?
Outils primordial pour la gestion des données et pour pouvoir les retravailler.
How would you sum up your experience?
Bonne opinion, c'est un produit qui s'adapte à beaucoup de situations.
Role
Project manager for BI/analytics from IT
Number of employees
100 - 2.500
Industry
Transportation and logistics
Source
Invited by the vendor, The BI & Analytics Survey 25, 05/2024
What do you like best?
Everyone knows how to use it, easy and available. Gets basic reporting and data manipulation done.
What do you like least/what could be improved?
Lacking visualization capabilities and taking things to next level.
What key advice would you give to other companies looking to introduce/use the product?
Look at more advanced systems. We have Targit but people still default to Excel.
How would you sum up your experience?
Good not great.
Role
Employee of a cross-departmental BI/analytics team
Number of employees
100 - 2.500
Industry
Manufacturing
Source
Invited by the vendor, The BI & Analytics Survey 25, 05/2024
What do you like best?
The extreme flexibility, the price point, the availability, the connectors and the constant product development. Widely known product with a large community and user base - always possible to find information and solutions to problems online.
What do you like least/what could be improved?
The flexibility of the product is both good and bad - traditional BI systems like PowerBI, Targit, Qlick etc. is a more locked environment, so when you release reports, dashboards or analysis to users, there is a smaller risk of the users breaking it. Interactive dashboards does not work very well in Excel.
What key advice would you give to other companies looking to introduce/use the product?
Do it. Excel is a must have for business users. The flexibility in Excel can overcome the limitations of other BI softwares, but the flexibility also comes with a price. Try to centralize the creation of reports and avoid to many customized and personal reports.
How would you sum up your experience?
Very positive. And it seems like Excel 365 is even better, so we look forward to being upgraded to this version.
Role
Head of business department
Number of employees
More than 2.500
Industry
Non-profit sector
Source
BARC Panel, The BI & Analytics Survey 25, 05/2024
What do you like best?
Einfach zu bedienen.
What do you like least/what could be improved?
Moderen oberfläche, schneller.
What key advice would you give to other companies looking to introduce/use the product?
Ist nur eine Notlösung.
How would you sum up your experience?
Begrenzt einsetzbar.
Role
Project manager for BI/analytics from IT
Number of employees
100 - 2.500
Industry
Manufacturing
Source
BARC Panel, The BI & Analytics Survey 25, 06/2024
What do you like best?
User familiarity, flexibility.
What do you like least/what could be improved?
Siloed data, redundancy, manual efforts for data preparation, limited capacity.
What key advice would you give to other companies looking to introduce/use the product?
Combine it with other platforms like Power BI/Fabric to get best of both worlds.
How would you sum up your experience?
Great general purpose tool. Vastly imperfect analytics tool.