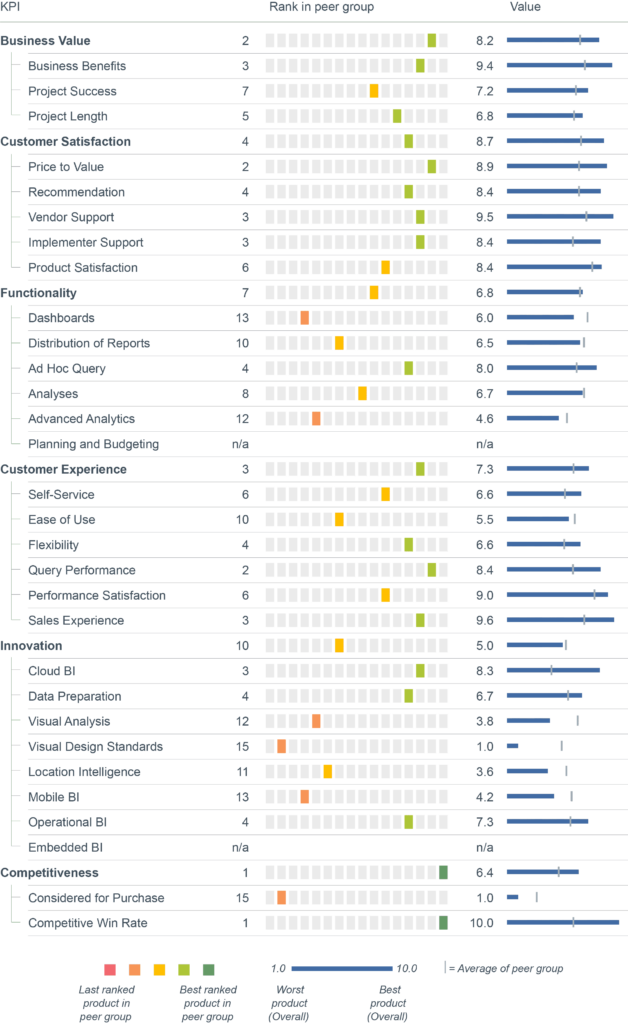
Why users buy Microsoft Power BI Report Server (PBIRS) and what problems they have using it
Premium content. Unlock with BARC+.
For just €79 per month (€948 per year) you can access all the paid content on www.barc.com.
Your benefits:
Get independent information on software solutions, market developments and trends in data, analytics, business intelligence, data science and corporate performance management.
Make data & analytics decisions based on numbers, data, facts and expert knowledge
Access to all premium articles and all our research, including all software comparison studies, scores and surveys.
Full user reviews and KPI results for Microsoft Power BI Report Server (PBIRS)
All key figures for Microsoft Power BI Report Server (PBIRS) at a glance.
Premium content. Unlock with BARC+.
For just €79 per month (€948 per year) you can access all the paid content on www.barc.com.
Your benefits:
Get independent information on software solutions, market developments and trends in data, analytics, business intelligence, data science and corporate performance management.
Make data & analytics decisions based on numbers, data, facts and expert knowledge
Access to all premium articles and all our research, including all software comparison studies, scores and surveys.
Individual user reviews for Microsoft Power BI Report Server (PBIRS)
Role
Project manager for BI/analytics from business department
Number of employees
100 - 2.500
Industry
Retail
Source
BARC Panel, AI & Analytics Survey 27, 04/2026
What do you like best?
Einbindung externer Tools für IBCS.
What do you like least/what could be improved?
Skalierbarkeit bei unterschiedlichen Bildschirmgrößen.
What key advice would you give to other companies looking to introduce/use the product?
Weniger ist mehr.
How would you sum up your experience?
–
Role
Member of a cross-departmental BI/analytics team
Number of employees
Mehr als 2.500
Industry
Manufacturing
Source
BARC Panel, AI & Analytics Survey 27, 05/2026
What do you like best?
Fabric ist modern und wird ständig um neue Möglichkeiten erweitert. Zusammen mit Microsoft 365 und Copilot ein echt tolles Paket.
What do you like least/what could be improved?
Power BI ist noch etwas hölzern in der Anwendung, zumindest für die Dashboard-Entwickler.
What key advice would you give to other companies looking to introduce/use the product?
Einen möglichst erfahrenen Solution-Partner für die Einführung auszuwählen.
How would you sum up your experience?
Tolles Produkt. Wir arbeiten sehr gerne damit.
Role
Line of business employee
Number of employees
Mehr als 2.500
Industry
Manufacturing
Source
BARC Panel, AI & Analytics Survey 27, 04/2026
What do you like best?
Intuitiv für die Anwender.
What do you like least/what could be improved?
Layoutvorgaben, Erstellen von Custom Visuals vereinfachen, Visual-Freigabe ermöglichen (damit nicht die komplette Organisation immer alles automatisch bekommt) und Datenquellen einschränken.
What key advice would you give to other companies looking to introduce/use the product?
Prozesse, Regelungen, Verantwortlichkeiten und Datenprodukte zur Verfügung stellen. Unterscheidung zwischen Standardreporting und Self-Service-BI-Reporting.
How would you sum up your experience?
Das Tool ermöglicht für Anfänger einen guten Einstieg, da sehr viele Infos/Schulungen im Netz existieren. Ebenso bietet es sehr viele Freiheiten für die Nutzer. Diese Freiheiten stellen allerdings ein sehr großes Problem dar, da eine Standardisierung sehr aufwendig einzuführen ist.
Role
Project manager for BI/analytics from IT
Number of employees
Mehr als 2.500
Industry
Utilities
Source
BARC Panel, AI & Analytics Survey 27, 04/2026
What do you like best?
Sehr intuitiv für Berichtsersteller. Auch bisherige Excel-Nutzer können sich relativ leicht einarbeiten.
What do you like least/what could be improved?
Visuals sind sehr starr und erlauben teilweise auch Excel-Funktionen nicht.
What key advice would you give to other companies looking to introduce/use the product?
Power BI ist keine Planungs-, sondern eine Reportingsoftware.
How would you sum up your experience?
Insgesamt sehr positiv, allerdings kommt das Tool insbesondere beim Zurückschreiben von Daten an seine Grenzen.
Role
Line of business employee
Number of employees
Mehr als 2.500
Industry
Banking and finance
Source
BARC Panel, AI & Analytics Survey 27, 05/2026
What do you like best?
Blazing-fast reporting, massive datasets in OneLake, unified storage.
What do you like least/what could be improved?
High licensing costs and some features users often find complex and confusing.
What key advice would you give to other companies looking to introduce/use the product?
Adopt a phased approach and leverage workspace identity technology for secure, resilient data management.
How would you sum up your experience?
Promising all-in-one analytical platform that favors seamless integration with other technologies and in-house systems.
Role
Project manager for BI/analytics from business department
Number of employees
Weniger als 100
Industry
Transportation and logistics
Source
BARC Panel, AI & Analytics Survey 27, 04/2026
What do you like best?
Simplicity and visual appeal.
What do you like least/what could be improved?
Better AI integration.
What key advice would you give to other companies looking to introduce/use the product?
Proper API data (remember GIGO: Garbage In, Garbage Out).
How would you sum up your experience?
Simple.
Role
IT employee
Number of employees
Mehr als 2.500
Industry
Manufacturing
Source
BARC Panel, AI & Analytics Survey 27, 04/2026
What do you like best?
Microsoft Power BI (with Microsoft Fabric) stands out for combining data integration, transformation, and visualization in one platform. It’s user-friendly yet powerful, integrates seamlessly with the Microsoft ecosystem, enables real-time insights, and delivers strong value at a relatively low cost.
What do you like least/what could be improved?
Steep learning curve for DAX and data modeling. Performance issues with large datasets. Limited version control and deployment management. UI can feel cluttered and less intuitive at times. Licensing and pricing, especially with Fabric, can get confusing.
What key advice would you give to other companies looking to introduce/use the product?
Start with a clear data strategy (don't just build random dashboards). Invest early in data modeling and governance. Train users on DAX and best practices. Begin small (pilot use cases) and scale gradually. Set up proper workspace structure and security from day one. Monitor performance and optimize as data grows.
How would you sum up your experience?
Overall, Microsoft Power BI with Microsoft Fabric is a powerful, cost-effective, and scalable data platform, great for most businesses, but needs proper setup and expertise to use it effectively.
Role
Line of business employee
Number of employees
Mehr als 2.500
Industry
Manufacturing
Source
BARC Panel, AI & Analytics Survey 27, 05/2026
What do you like best?
Easy to handle for users and developers. Microsoft Fabric will hopefully boost automation.
What do you like least/what could be improved?
Data semantics should be handled outside Power BI (probably Fabric will deliver the needed solutions).
What key advice would you give to other companies looking to introduce/use the product?
Train a few experts to build the global standard dashboards and convince management to use Power BI directly. Build the semantic model outside Power BI!
How would you sum up your experience?
Good, easy, and cost-efficient model!
Role
Head of business department
Number of employees
100 - 2.500
Industry
Manufacturing
Source
BARC Panel, AI & Analytics Survey 27, 04/2026
What do you like best?
Community und Innovationskraft.
What do you like least/what could be improved?
Kunden sind die Versuchskaninchen. Viele Preview-Features.
What key advice would you give to other companies looking to introduce/use the product?
Gute Planung. Realistische Erwartungshaltung. Kosten von Anfang an im Blick behalten.
How would you sum up your experience?
Befriedigend.
Role
Head of business department
Number of employees
Mehr als 2.500
Industry
Manufacturing
Source
BARC Panel, AI & Analytics Survey 27, 04/2026
What do you like best?
Fast setup of reports once sources and specifications are known.
What do you like least/what could be improved?
The hidden fact is that creating more complicated reports requires a lot of setup that very quickly turns into inflexible setup and hidden errors.
What key advice would you give to other companies looking to introduce/use the product?
Set up a clear control framework and define which definitions reports should adhere to for each topic, so that content can be better controlled and the Power BI offering does not end up being an uncontrollable wilderness of customized reports.
How would you sum up your experience?
It is available and has an attractive price, but I am not sure it is the best solution or whether its overwhelming presence stifles the incentive to develop better solutions.
Role
Head of business department
Number of employees
100 - 2.500
Industry
Services
Source
BARC Panel, AI & Analytics Survey 27, 05/2026
What do you like best?
Solid Microsoft product that makes it easier to push to staff.
What do you like least/what could be improved?
It is almost too broad, allowing people to go off and do what they want.
What key advice would you give to other companies looking to introduce/use the product?
Worth doing. Make sure you have some people with good knowledge and skills in building with it.
How would you sum up your experience?
Good.
Role
Project manager for BI/analytics from business department
Number of employees
Mehr als 2.500
Industry
Manufacturing
Source
BARC Panel, AI & Analytics Survey 27, 05/2026
What do you like best?
Power BI als Reporting-Umgebung ist sehr gut, Microsoft Fabric hat noch einen Beta-Status.
What do you like least/what could be improved?
Bzgl. Microsoft Fabric gibt es noch sehr viele Preview-Features und damit nach Konferenzen oft auch Bugs und Probleme mit der Auslastung der Kapazität.
What key advice would you give to other companies looking to introduce/use the product?
Genau überlegen, wozu Microsoft Fabric eingesetzt werden soll. Die Idee, dass alles von einem Hersteller kommt und zusammen viel besser funktionieren sollte, z. B. Teams mit Word und Excel, Microsoft-Fabric-Daten aus SAP und die Darstellung in Power BI, ist noch nicht durchgehend realisierbar. Die verfügbaren Funktionen unterscheiden sich auch noch in den Regionen, denen eine Microsoft-Kapazität zugeordnet ist.
How would you sum up your experience?
Das Produkt (nicht Power BI) ist noch in der Entstehung. Das sieht man an vielen Stellen. Ein grobes Monitoring (Capacity Metrics oder Fabric Unified Admin Monitoring) hilft nur bedingt. Microsoft Fabric hat noch mehr einen Explorations-Charakter und ist nicht stabil/seriös. Leider.
Role
IT employee
Number of employees
100 - 2.500
Industry
Manufacturing
Source
BARC Panel, AI & Analytics Survey 27, 05/2026
What do you like best?
Man kann sehr schnell zu Ergebnissen kommen, ohne größere Einarbeitung / Schulung.
What do you like least/what could be improved?
Das Lizenzmodell ist teilweise ziemlich undurchsichtig, besonders wenn man Reports im Web veröffentlichen möchte. Aus Entwicklersicht finde ich die Unterstützung von CI/CD noch zu schwach.
What key advice would you give to other companies looking to introduce/use the product?
Sich zuerst intensiv mit der Governance beschäftigen, bevor man mit Reports nach außen geht.
How would you sum up your experience?
Insgesamt eher positiv. Wir ermöglichen damit den Usern, Bottlenecks in der IT zu umgehen und sich ihre Reports selbst zu erstellen.
Role
IT employee
Number of employees
Mehr als 2.500
Industry
Manufacturing
Source
BARC Panel, AI & Analytics Survey 27, 04/2026
What do you like best?
Yes, the features are good, but it needs something like AI improvement.
What do you like least/what could be improved?
AI feature.
What key advice would you give to other companies looking to introduce/use the product?
–
How would you sum up your experience?
Good for detail but not enough for deep analysis.
Role
Project manager for BI/analytics from IT
Number of employees
Mehr als 2.500
Industry
Transportation and logistics
Source
BARC Panel, AI & Analytics Survey 27, 04/2026
What do you like best?
Integration in Microsoft Office. Integration in Microsoft Dynamics 365 und integrierte kommerzielle Vereinbarungen.
What do you like least/what could be improved?
–
What key advice would you give to other companies looking to introduce/use the product?
Denkweise vom alten System wegwerfen, neue Architekturen nutzen.
How would you sum up your experience?
Sehr positiv. Einfache Integration in SharePoint, Teams.
Role
IT employee
Number of employees
Mehr als 2.500
Industry
Retail
Source
BARC Panel, AI & Analytics Survey 27, 05/2026
What do you like best?
Marketing.
What do you like least/what could be improved?
Reifegrad.
What key advice would you give to other companies looking to introduce/use the product?
Abwarten.
How would you sum up your experience?
Schlechter als sein Ruf.
Role
Project manager for BI/analytics from business department
Number of employees
100 - 2.500
Industry
Process industry
Source
BARC Panel, AI & Analytics Survey 27, 04/2026
What do you like best?
Umfassende Funktionalität, hohe Innovationsgeschwindigkeit und relativ einfache Bedienung.
What do you like least/what could be improved?
Preismodell: Der Import von wenigen Daten kostet sehr viel. Die Verfügbarkeit von Daten im Mirroring/Endpoint ist nicht transparent (zwischen Sekunden und Stunden).
What key advice would you give to other companies looking to introduce/use the product?
Klärung des Ressourcenbedarfs für den Datenimport.
How would you sum up your experience?
Funktionalität passt sehr gut. Die Implementierung im Zusammenhang mit dbt ist sehr effizient.
Role
Line of business employee
Number of employees
Mehr als 2.500
Industry
Manufacturing
Source
BARC Panel, AI & Analytics Survey 27, 05/2026
What do you like best?
Easy to use.
What do you like least/what could be improved?
SAP connection.
What key advice would you give to other companies looking to introduce/use the product?
Online training.
How would you sum up your experience?
Good.
Role
Project manager for BI/analytics from business department
Number of employees
Weniger als 100
Industry
Insurance
Source
BARC Panel, AI & Analytics Survey 27, 05/2026
What do you like best?
Einfaches Layout und intuitive Bedienung.
What do you like least/what could be improved?
Flexibilität beim Entwickeln.
What key advice would you give to other companies looking to introduce/use the product?
Saubere Datengrundlage und Ladeprozesse.
How would you sum up your experience?
Sehr gut.
Role
Consultant
Number of employees
Mehr als 2.500
Industry
Process industry
Source
BARC Panel, AI & Analytics Survey 27, 05/2026
What do you like best?
Time to market. Echtes semantisches Modell.
What do you like least/what could be improved?
Echtes Mirroring von Databricks-Tabellen.
What key advice would you give to other companies looking to introduce/use the product?
Workspaces und Kapazitäten genau planen. Domänenkonzept nutzen (Fabric-unabhängig).
How would you sum up your experience?
Das Tool bremst bei den teilweise langen Prozessen nicht.
Role
CIO
Number of employees
Mehr als 2.500
Industry
Healthcare
Source
BARC Panel, AI & Analytics Survey 27, 05/2026
What do you like best?
Easy to use and well integrated into our Microsoft ecosystem.
What do you like least/what could be improved?
The evolution of Fabric and the effort required to understand it are challenging.
What key advice would you give to other companies looking to introduce/use the product?
Do the prep work to understand Fabric.
How would you sum up your experience?
I have a high opinion of Microsoft Power BI (Microsoft Fabric).
Role
Project manager for BI/analytics from IT
Number of employees
Mehr als 2.500
Industry
Manufacturing
Source
BARC Panel, AI & Analytics Survey 27, 05/2026
What do you like best?
What I like most is that it helps a controlling organization move from manual, spreadsheet-heavy reporting to faster, more transparent, more drillable financial insight.
What do you like least/what could be improved?
It can still require a lot of setup, governance, and data discipline before it really works well. Power BI is great, but it does not fix bad source data. In controlling, if hierarchies are inconsistent, master data is messy, actuals/forecast logic differs by team, or ERP data is late or incomplete, then Power BI can expose those issues fast. That's useful, but also frustrating.
What key advice would you give to other companies looking to introduce/use the product?
Start with governance and business definitions before building dashboards. From a controlling/finance perspective, the biggest success factor is not the tool itself. It's making sure everyone agrees on KPI definitions, hierarchies, source systems, refresh timing, security/access, and who owns the data.
How would you sum up your experience?
I think Microsoft Power BI / Fabric is a very strong platform, especially for organizations that want to make data more accessible to business users without needing everything to go through IT. What I think it does well: makes reporting and analytics more accessible, fits well into the Microsoft ecosystem, supports self-service analysis, gives strong visualization and drill-down capability, can be very effective for finance and controlling use cases, Fabric is appealing because it moves toward a more end-to-end data platform. Where I think the caution is: it's powerful, but it's not a magic fix. Its success really depends on data quality, governance, consistent metric definitions, good model design, and user adoption. Without those things, you can still end up with multiple versions of the truth.
Role
Project manager for BI/analytics from business department
Number of employees
Weniger als 100
Industry
Consulting
Source
BARC Panel, AI & Analytics Survey 27, 04/2026
What do you like best?
Solid platform that continues to evolve. Packs a lot of power.
What do you like least/what could be improved?
Can be somewhat complicated to navigate within the Fabric landscape.
What key advice would you give to other companies looking to introduce/use the product?
Power BI is quite easy to get started with, though complexity can build up fast when you dive into Fabric's massive tool palette.
How would you sum up your experience?
Very capable suite of tools, which can solve everything. But consider other complementary cloud platforms that can help you achieve your goals. It doesn't have to be Fabric from start to end.
Role
Project manager for BI/analytics from business department
Number of employees
100 - 2.500
Industry
Banking and finance
Source
BARC Panel, AI & Analytics Survey 27, 05/2026
What do you like best?
Large support community and constant updates.
What do you like least/what could be improved?
The interface is not user-friendly, especially when it comes to customizing visuals.
What key advice would you give to other companies looking to introduce/use the product?
You will need to know DAX to create anything beyond basic functionality.
How would you sum up your experience?
Can be annoying.
Role
Consultant
Number of employees
Weniger als 100
Industry
Media/Publishing
Source
BARC Panel, AI & Analytics Survey 27, 06/2026
What do you like best?
Solid company support and reliable.
What do you like least/what could be improved?
The overall cost.
What key advice would you give to other companies looking to introduce/use the product?
We like it, but the competition is worth looking at and is catching up fast.
How would you sum up your experience?
As stated above. Overall a good choice and very reliable.
Role
IT employee
Number of employees
Mehr als 2.500
Industry
Retail
Source
BARC Panel, AI & Analytics Survey 27, 05/2026
What do you like best?
In SharePoint integriert.
What do you like least/what could be improved?
Teuer.
What key advice would you give to other companies looking to introduce/use the product?
Erst mal Open Source evaluieren.
How would you sum up your experience?
Passt für uns.
Role
Project manager for BI/analytics from IT
Number of employees
Mehr als 2.500
Industry
Insurance
Source
BARC Panel, AI & Analytics Survey 27, 05/2026
What do you like best?
Teil der Microsoft Office Suite.
What do you like least/what could be improved?
Benutzerführung.
What key advice would you give to other companies looking to introduce/use the product?
Keine Wunder erwarten.
How would you sum up your experience?
Schnell recht hohe Akzeptanz.
Role
CEO
Number of employees
Weniger als 100
Industry
Consulting
Source
BARC Panel, AI & Analytics Survey 27, 04/2026
What do you like best?
–
What do you like least/what could be improved?
Direkte Rückschreibemöglichkeit in Datenquellen (zumindest Excel, SharePoint und Dataverse).
What key advice would you give to other companies looking to introduce/use the product?
Absolute Empfehlung, dies zu tun!
How would you sum up your experience?
Sehr effizient, schnell in der Umsetzung neuer Anforderungen und der Horizont ist nicht absehbar.
Role
Member of a cross-departmental BI/analytics team
Number of employees
100 - 2.500
Industry
Manufacturing
Source
BARC Panel, AI & Analytics Survey 27, 04/2026
What do you like best?
–
What do you like least/what could be improved?
Sehr schlecht im Bereich Ad-hoc-Analysen. Für Fachanwendungen, z.B. im Bereich Controlling, ist es kaum möglich, schnell einen Bericht zusammenzustellen.
What key advice would you give to other companies looking to introduce/use the product?
Unbedingt prüfen, ob Power BI alle benötigten Aspekte von BI/Analytics im Unternehmen abdeckt. Gegebenenfalls ein zweites Tool oder alternative Möglichkeiten für datenorientierte Fachbereiche erwägen.
How would you sum up your experience?
Gute UI für gelegentliche Anwender. Schnell und für das Management können gut bedienbare, aussagekräftige Reports/Dashboards erstellt werden. Schwach im Bereich Ad-hoc-Datenanalyse (OLAP). Kernfunktionen fehlen seit Jahren. Im Kernbereich kaum Weiterentwicklung. Microsoft konzentriert sich auf Fabric/AI-Features.
Role
Consultant
Number of employees
Mehr als 2.500
Industry
Banking and finance
Source
BARC Panel, AI & Analytics Survey 27, 05/2026
What do you like best?
Office integration.
What do you like least/what could be improved?
The product became too fragmented, licensing is complicated and performance tuning is poor.
What key advice would you give to other companies looking to introduce/use the product?
Don't start with technology, start with business outcomes.
How would you sum up your experience?
Good, but could be much better.
Role
Project manager for BI/analytics from IT
Number of employees
100 - 2.500
Industry
Insurance
Source
BARC Panel, AI & Analytics Survey 27, 05/2026
What do you like best?
Accessibility across the organization. Security at the data layer.
What do you like least/what could be improved?
Not the best enterprise platform. Also would be great if the designer was fully in the browser and didn't need the client on your workstation. Reporting (PDF or HTML outputs) is pretty bad, and scheduling email delivery of reporting outputs is far behind the competitors.
What key advice would you give to other companies looking to introduce/use the product?
It is a great platform. There are some hurdles if you would like to extend it across your enterprise. Governance and partnerships are key.
How would you sum up your experience?
It does what it does well.
Role
Member of a cross-departmental BI/analytics team
Number of employees
Mehr als 2.500
Industry
Healthcare
Source
BARC Panel, AI & Analytics Survey 27, 05/2026
What do you like best?
Integrates well with EHR.
What do you like least/what could be improved?
Rigid at times.
What key advice would you give to other companies looking to introduce/use the product?
Manage expectations. Be ready for additional stuff to be more agile.
How would you sum up your experience?
Works. Solid enterprise tooling.
Role
CIO
Number of employees
Mehr als 2.500
Industry
Healthcare
Source
BARC Panel, AI & Analytics Survey 27, 05/2026
What do you like best?
Low cost.
What do you like least/what could be improved?
More powerful data mining.
What key advice would you give to other companies looking to introduce/use the product?
Trying is a first step.
How would you sum up your experience?
Good.
Role
Business analyst
Number of employees
100 - 2.500
Industry
Healthcare
Source
BARC Panel, AI & Analytics Survey 27, 05/2026
What do you like best?
Ease of use and compatibility with our IT infrastructure.
What do you like least/what could be improved?
Licensing.
What key advice would you give to other companies looking to introduce/use the product?
Use it.
How would you sum up your experience?
It's good on-premises. It's expensive in the cloud.
Role
IT employee
Number of employees
Mehr als 2.500
Industry
Retail
Source
BARC Panel, AI & Analytics Survey 27, 05/2026
What do you like best?
It's pretty.
What do you like least/what could be improved?
Slow and cumbersome.
What key advice would you give to other companies looking to introduce/use the product?
Look into Dimensional Insight.
How would you sum up your experience?
Not good at all for ad-hoc analytics and self-service.
Role
Line of business employee
Number of employees
100 - 2.500
Industry
Manufacturing
Source
BARC Panel, AI & Analytics Survey 27, 04/2026
What do you like best?
Ecosystem.
What do you like least/what could be improved?
Dependent on Microsoft.
What key advice would you give to other companies looking to introduce/use the product?
The quality-to-price ratio is good if you already use Microsoft.
How would you sum up your experience?
Satisfactory.
Role
Project manager for BI/analytics from IT
Number of employees
100 - 2.500
Industry
Retail
Source
BARC Panel, AI & Analytics Survey 27, 05/2026
What do you like best?
Funktionsumfang.
What do you like least/what could be improved?
–
What key advice would you give to other companies looking to introduce/use the product?
Einen starken Implementierungspartner mit ins Boot holen.
How would you sum up your experience?
Die Entscheidung wurde nie bereut, auf Power BI zu setzen.
Role
Consultant
Number of employees
100 - 2.500
Industry
Manufacturing
Source
BARC Panel, AI & Analytics Survey 27, 05/2026
What do you like best?
DAX.
What do you like least/what could be improved?
–
What key advice would you give to other companies looking to introduce/use the product?
Von Anfang an einen guten Implementierungspartner suchen.
How would you sum up your experience?
Äußerst positiv.
Role
Head of business department
Number of employees
Mehr als 2.500
Industry
Agriculture
Source
BARC Panel, AI & Analytics Survey 27, 04/2026
What do you like best?
Einfache und rasche Implementierung.
What do you like least/what could be improved?
Einschränkungen bei der Visualisierung; zum Beispiel sollte Zebra BI zusätzlich angeschafft werden.
What key advice would you give to other companies looking to introduce/use the product?
Bereinigt eure Daten.
How would you sum up your experience?
Ich habe Power BI jetzt zum zweiten Mal als Reporting-Lösung ausgerollt.