What the data from over 2,500 BI projects tells us
Companies still spend significant time and energy trying to make the best buying decision
Despite BI vendors’ efforts to make the BI software buying process easier, companies still spend significant time and energy trying to make the best decision. Subscription licensing and trial periods have helped by minimizing risk in some cases but these advantages have been outweighed by new challenges stemming from sorting through a plethora of new offerings.
The following article provides help to buyers in the form of information on BI products that respondents evaluated, their license costs, and the factors that ultimately influenced their selection decisions.
Plans for using BI products
Understanding upcoming priorities for the major BI task areas is a good place to start when analyzing the BI software selection results from The BI Survey.
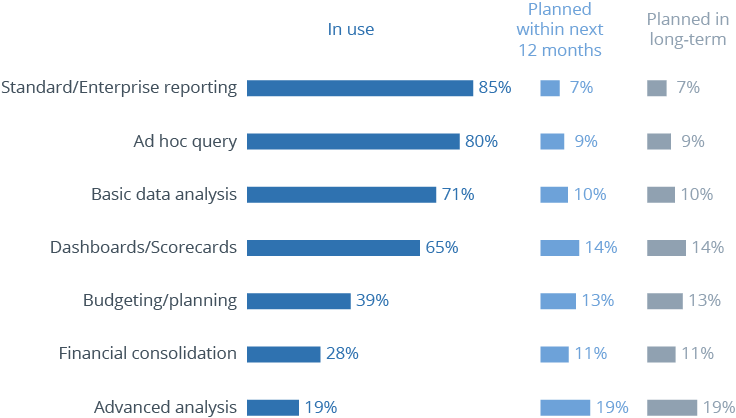
The chart below shows swelling demand for advanced analysis in both the medium and long term. The top three investment areas are “advanced analysis” (19 percent), “dashboards/scorecards” (14 percent), and “budgeting/planning” (13 percent).
This correlates with recent BI product releases from vendors such as Dundas and Tableau which feature more advanced visualizations that support forecasting and relationship analysis without the need for in-house math and statistics experts.
Business intelligence products evaluated
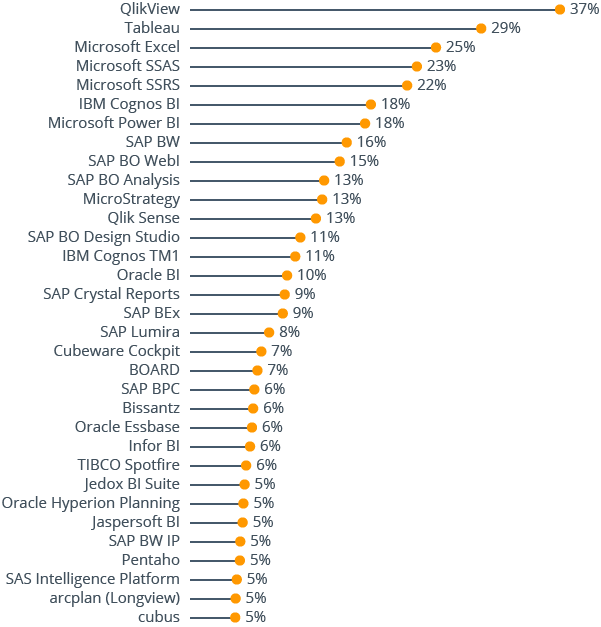
In 2016, QlikView was once again the most evaluated BI tool, appearing in 37 percent of selection decisions. The rest of the top five include Tableau (29 percent), Microsoft Excel (25 percent), Microsoft SQL Server Analysis Services (23 percent) and Microsoft SQL Server Reporting Services (22 percent).
The top three are very user-focused offerings, all having roots as desktop solutions requiring little or no IT support. This reaffirms the importance of self-service BI and easy setup across all geographies and company sizes.
BI products acquired
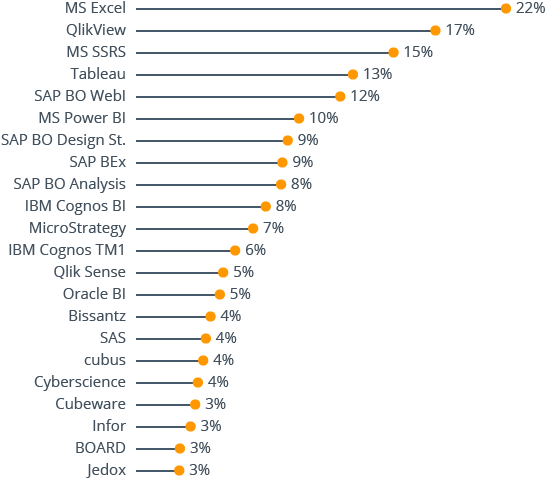
According to BI Survey respondents, only Excel gets acquired more often than Qlik. 17 percent of our survey respondents selected Qlik’s QlikView product. Qlik’s online resources and community make it relatively easy to find examples and get help – possibly contributing to more successful evaluations and proof-of-value. Microsoft Excel, SAP BO WebI, Tableau and MicroStrategy round out the top five.

Reasons to buy
When understanding drivers for business intelligence product selection, the following chart provides greater insight by overlaying project size into the survey results.
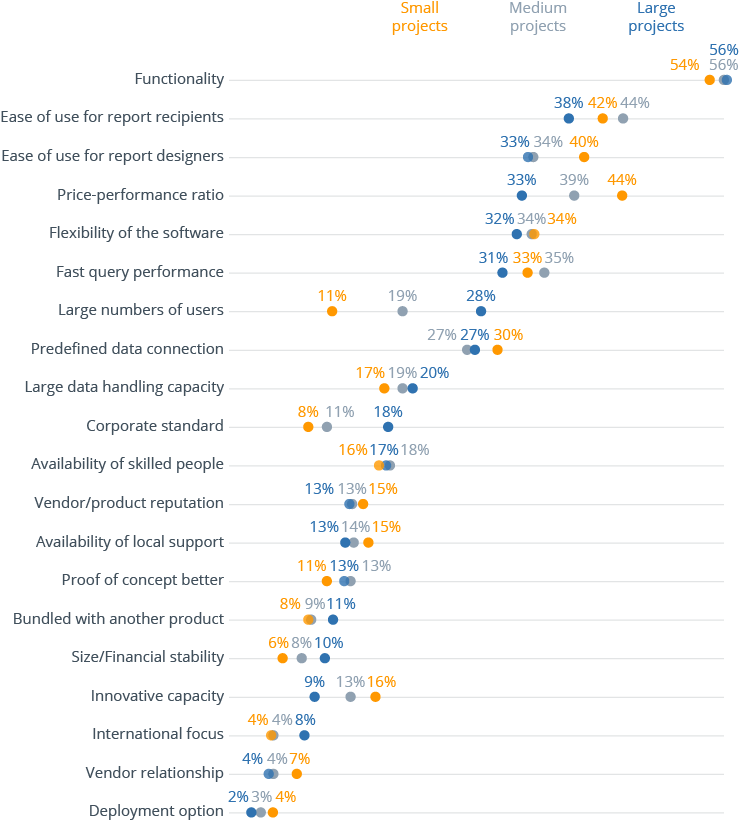
When differentiating between project sizes, some interesting insights emerge:
- Functionality is the top reason to buy regardless of project size
- Price-performance trumps ease of report creation, and even ease of report viewing in small projects
- Software flexibility, data connections, and availability of skilled resources are similarly valued across all project sizes
- The innovative capacity of the vendor is valued much more in small and medium projects
- With an 11-point spread, price-performance ratio is the factor with the greatest difference in importance between small and large projects
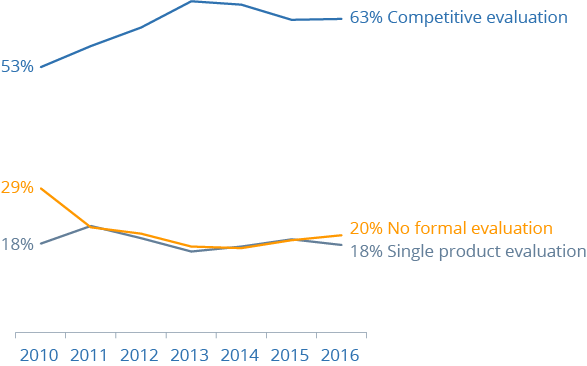
BI software selection method – timeline
Starting in 2013, the percentage of companies conducting a formal competitive evaluation to select BI software began to decline.
Today, we see that this trend is starting to reverse with competitive evaluations ticking up again. Buyers still use competitive evaluations with approximately three times the frequency of single product evaluations or no formal evaluation at all.
In 2016 the percentage of companies that didn’t conduct a formal evaluation when selecting a BI product was higher than those conducting a “single” product evaluation. Drivers for reduced up-front selection rigor might include increased point solutions purchased at department level where buyers are seeking a tool to solve a very specific problem. Another driver is the increasing availability of videos, demo sites and other readily available online materials that assist buyers in making selection decisions.
Why business intelligence tools are chosen
Summarizing results around why companies choose certain products, buyers are placing greater emphasis on ease-of-use for report designers, availability of skilled resources, and the international focus of the vendor. Looking at the charts below, we see company size, financial stability, software flexibility, and even performance decreasing as selection factors since 2015.
These trends paint something of mixed picture as they emphasize strengths that are associated with vendors who have a global presence and larger support and service staffs. But there is also an increased importance placed on report designers … a strong area of focus amongst the smaller, younger, and more innovative vendors.
The next few charts show each BI software selection factor accompanied by a brief analysis of how these factors are changing in priority over time.
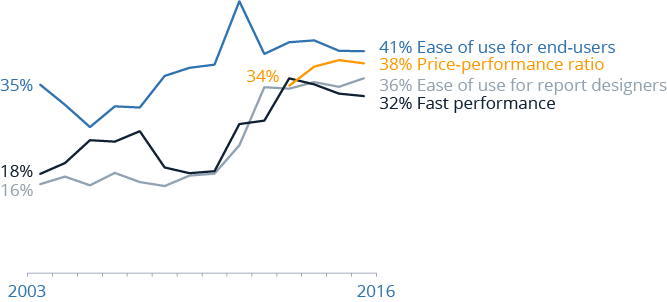
- All four factors in the chart above have clustered together becoming similar in importance over the past four years
- Still a top driver, ease of use for end users has stabilized in terms of priority
- Price-performance ratio has taken a slight dip after two years on the rise
- Fast performance is in its fourth year of decline, somewhat odd given the rise of big data. It might be explained by increased use of push-down approaches where workloads are delegated to the database engine
- Ease of use for report designers has ticked up, this demonstrates that recent improvements in self-service have their limits and activities like custom calculations and layouts can still be difficult
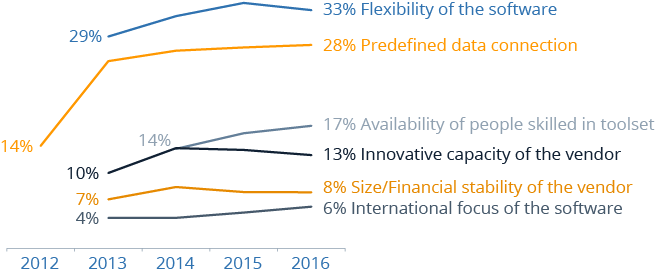
- Though still a top priority, flexibility of software ticked down; this might be explained by a growing number of point solution purchases where requirements are more specific and limited
- Predefined data connections continues its gradual increase as a purchase factor. With more companies moving to the cloud and evaluating different data repositories like Hadoop and NoSQL, we would expect this uptrend to continue
- Skilled resources gets a strong upward tick while “Innovative capacity of the vendor” gets an equally strong tick downward
- The importance of a vendor’s size/financial strength remains steady
- International focus and ability to serve global users is on the rise
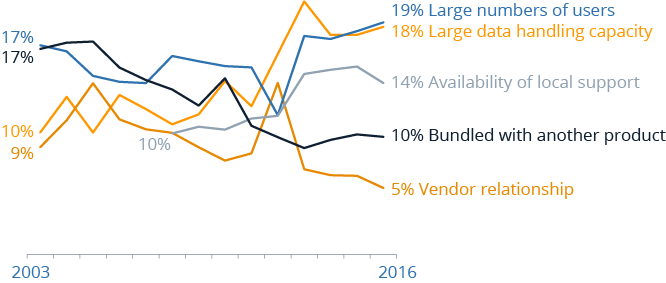
- The two largest purchase drivers on the chart above – large data handling capacity and large numbers of users – continue to rise in importance. One would think that performance would rise in conjunction with these two factors but it is not currently panning out this way
- Likely driven by online resources and globally located support teams, local support takes a big tick downwards
- After two years on the rise, bundling with other products takes a slight dip
- Vendor relationship continues to decline with a fourth straight drop as a buying factor
Total license costs and models for BI products
The rise in cloud-based computing and SaaS BI offerings that provide easy access to groups or even individual users continues to transform the accessibility and economic landscape of the BI industry.
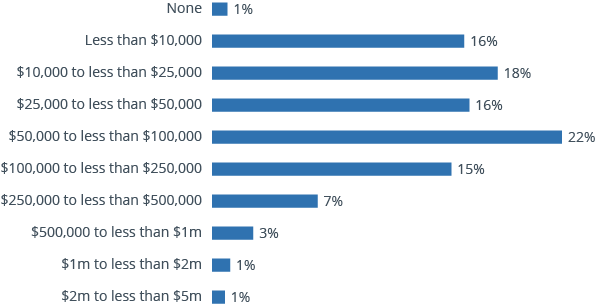
While BARC cannot see into the future and where price points will be in five years, survey results indicate trends and potential trajectories. Key highlights from The BI Survey results include:
- Similar to last year, total license spends of less than $100K accounted for 73 percent of all transactions
- Transactions exceeding $1 million doubled to 2 percent
- Transactions between $100,000 and $1 million increased 3 percentage points
Although companies are spending less money upfront on BI software and may be spreading out costs over time through subscriptions, we also see small increases at the three highest cost bands.
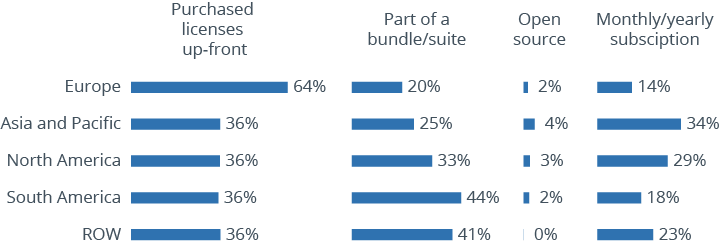
At the same time, the results show wide adoption of subscription licensing models in North America and the Asia Pacific region. These models can generate significant revenues for vendors with each month or year that their customers remain.