Oracle Analytics Cloud

What is Oracle Analytics Cloud?

Suite for reporting, dashboards and analysis. Predefined content created with OAC available. Oracle Analytics Server available as an on-premises version (functions are adjusted annually).

Customer Satisfaction
7.6
Rated 7.6 out of 10
User Experience
7.7
Rated 7.7 out of 10
Functionality
7.5
Rated 7.5 out of 10
Business Value
6.9
Rated 6.9 out of 10

Self-description of Oracle Analytics Cloud

No vendor self-description available
About BARC Reviews

Would you like to find out more about BARC reviews? Our FAQs answer the most important questions.

References
No data available
Partners
No data available
BARC studies, events and webinars with this vendor

Oracle Analytics Cloud BARC Review & Rating

Provider and product description

Oracle is a global provider of enterprise cloud computing, offering software, platform, infrastructure and even data as a service. With over 160,000 employees, Oracle is one of the giants in the market.

The Oracle Analytics offering rests on three major pillars: Oracle Analytics Cloud (OAC), Oracle Analytics Server (OAS) as well as predefined content and embedded analytics created using OAC, combined into the Fusion Data Intelligence offering.

OAC is Oracle’s flagship product for BI & analytics. The suite runs on Oracle Cloud Infrastructure (OCI) and can leverage OCI services such as Autonomous Data Warehouse. Oracle Analytics Server, the on-premises version of OAC, brings the capabilities of the cloud platform annually to organizations requiring on-premises deployments or wanting to run it in other clouds. For Oracle’s business application customers, Fusion Data Intelligence (FDI) combines predefined content built using Oracle Analytics Cloud and the OCI Data Lakehouse that equips customers with preconfigured connectivity to Oracle Cloud Applications as well as options to connect to third-party data. Besides that, the product serves customers with prebuilt AI content including ready-to-use models configured to support a specific operational task such as predicting sales order delivery. In addition, FDI is the basis for a range of intelligent applications that Oracle says go beyond dashboards and reports with prebuilt insights and AI/ML-driven recommendations to facilitate decisions and actions by role, task and industry. FDI is part of a range of OAC-based SaaS apps designed for organizations using other Oracle application offerings, such as Oracle NetSuite, Oracle Health etc. It was announced at Oracle Cloud World 2025 that OAC has been integrated into the Oracle AI Data Platform.

Oracle Analytics Cloud is a platform for dashboards, formatted reports, ad hoc reports, analysis, data preparation and machine learning. It offers different clients for different user types. Business users typically work with the modern web-based environment, which offers augmented data preparation and custom data transformations via Data Flows as well as visual analysis features. More mature clients, such as Answers (ad hoc reporting) and Publisher (for developer-oriented pixel-perfect reporting), still exist and are equipped with the same visualization engine. Mobile clients are also available.

All the clients can connect to Oracle’s enterprise semantic layer, which offers strong calculation and caching features and a common and governed business logic. The suite typically connects directly to underlying data using native connectors, OEM software, REST APIs or standards such as OData and JDBC/ODBC without replicating data. A semantic modeler (i.e., a web-based environment for creating SMML-based models) is now the main development environment for this layer. SMML is a JSON-based Semantic Modeler Markup Language that describes the semantic model’s objects. The model is integrated with Git to support software development and facilitate deployment, maintenance and version control. Moreover, Oracle’s semantic layer is open to be consumed by third-party applications such as Power BI. For openness, Oracle offers REST APIs for Oracle Analytics to provide developers with access to functionality in OAC. The vendor also provides a story exchange format, which allows customers to integrate with third-party video GenAI services to provide interactive and spoken stories using AI.

Business users can use the semantic layer, which is typically created by technically savvy users, or create their own data models (data sets). Oracle offers a self-optimized in-memory engine, which is used to ingest and cache data instead of connecting live to sources, making it a compelling option to boost performance and productivity without leaving the governance delivered by the platform.

With ‘Auto Insights’ and ‘Explain’, users can leverage automated insights generation powered by ML and NLG. Relevant drivers, patterns and clusters are identified and visualized. Beyond that, forecasts leveraging weighting algorithms can be created based on the drivers identified. Natural language queries (‘Ask’) can be used to analyze data without deep technical expertise or having to search across all data sets cataloged in many supported languages. Moreover, ‘Oracle Analytics AI Assistant’ – a GenAI assistant for analysts – is now generally available. The integration with Oracle CIoud Infrastructure (OCI) AI Services brings an additional set of AI-powered capabilities, such as document interpretation, to OAC.

Complementing the portfolio, machine learning algorithms are embedded out of the box with Oracle Analytics Cloud. R and Python scripts can be embedded to leverage the results of advanced analytics models. Additionally, ML algorithms embedded in Oracle databases can be leveraged without shifting data, providing enhanced speed and flexibility for analytics.

Strengths and challenges of Oracle Analytics Cloud

BARC’s viewpoint on the product’s strengths and challenges.

Strengths
  • Cloud and web-based platform for reports, analyses, visualization and dashboards. Also includes powerful and easy-to-use data preparation with good data profiling and user guidance through recommendations for transforming and enhancing data.
  • SMML-based semantic layer which provides a governed and trusted view of data (also for third-party tools such as Power BI) and facilitates modern software development workflows through its integration with Git.
  • Oracle offers the possibility to build independent self-service data sets for high flexibility as well as weaving semantic models together for a consistent enterprise-wide view.
  • Automated insights based on ML and ‘Ask’ NLQ as well as the Oracle Analytics AI Assistant drive acceptance and lower the barrier for business users to use analytics by helping them to find relevant signals for decision-making.
  • The integration with Oracle Cloud Infrastructure (OCI) AI Services enhances the AI capabilities within the platform and means that business users do not need to leave the platform, for example, to analyze unstructured data like pictures or documents.
Challenges
  • OAC is only available on Oracle Cloud. Customers seeking to deploy it on other cloud services must use OAS, which only receives functional updates once per year and must be managed by the customer.
  • Data models created by business users cannot be easily deployed to the central semantic layer as the data modeling environments are only partially integrated.
  • Integration between Publisher and Visualize is at data level only, reducing efficiency when creating content and making it harder for business users to leverage complete functionality.
Need more help finding the right software?

Find out how our expertise can help you.

Oracle Analytics Cloud User Reviews & Experiences

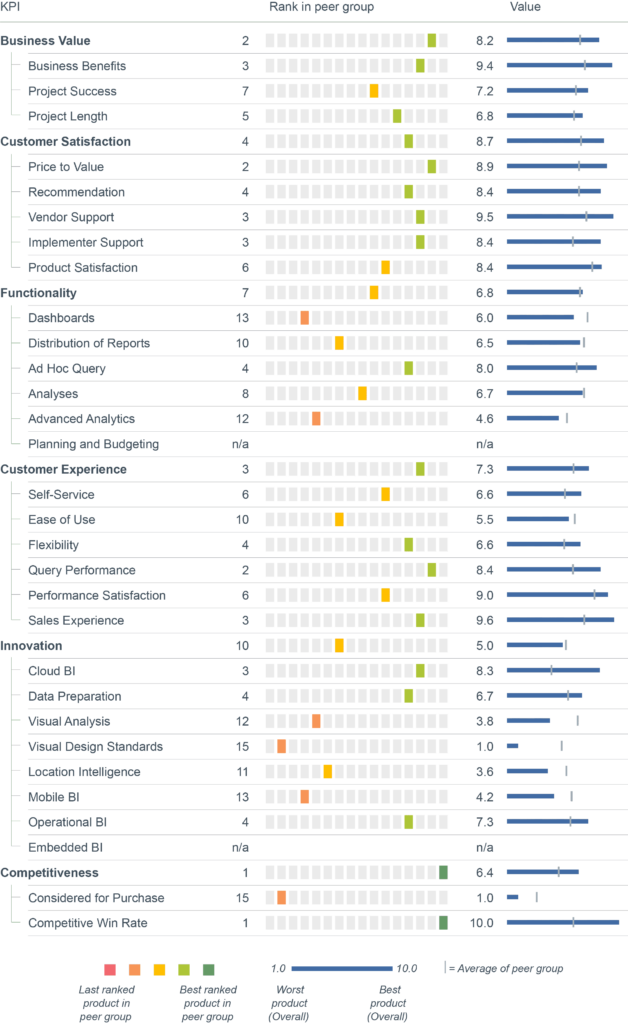
The information contained in this section is based on user feedback and actual experience with Oracle Analytics Cloud.

The information and figures are largely drawn from BARC’s The BI & Analytics Survey, The Planning Survey, The Financial Consolidation Survey and The Data Management Survey. You can find out more about these surveys by clicking on the relevant links.

Why users buy Oracle Analytics Cloud and what problems they have using it

Premium content. Unlock with BARC+.
For just €79 per month (€948 per year) you can access all the paid content on www.barc.com.
Your benefits:

Full user reviews and KPI results for Oracle Analytics Cloud

All key figures for Oracle Analytics Cloud at a glance.

Premium content. Unlock with BARC+.
For just €79 per month (€948 per year) you can access all the paid content on www.barc.com.
Your benefits:

Individual user reviews for Oracle Analytics Cloud

Role
Member of a cross-departmental BI/analytics team
Number of employees
Mehr als 2.500
Industry
Education
Source
BARC Marketing, AI & Analytics Survey 27, 06/2026
What do you like best?

From a report developer’s standpoint in IT, it is easy to use. I like both the Classic and DV versions of the product. Data Flows is a nice feature. The product continues to improve.

What do you like least/what could be improved?

Lack of support for REST APIs (the connector is still in beta). No support for the community edition of MySQL, which many SaaS providers use in their higher education products. Tooltips in DV do not fully support attributes. Some charts that can be created in Power BI are not possible in OAC.

What key advice would you give to other companies looking to introduce/use the product?

Fully embrace the product.

How would you sum up your experience?

On a scale of 1 to 10 (where 10 is excellent), I give this product an 8.5. Overall, it’s a wonderful environment to use. I came from a Tableau shop, and the Oracle Analytics Cloud version is much better, though it lacks a few features, as mentioned above in what I like least about the product.

Role
Head of business department
Number of employees
100 - 2.500
Industry
Process industry
Source
BARC Marketing, AI & Analytics Survey 27, 05/2026
What do you like best?

Cloud und Funktionsumfang für Power User.

What do you like least/what could be improved?

Preis.

What key advice would you give to other companies looking to introduce/use the product?

Inhouse-Kompetenz aufbauen.

How would you sum up your experience?

Okay.

Role
IT employee
Number of employees
100 - 2.500
Industry
Process industry
Source
BARC Marketing, AI & Analytics Survey 27, 04/2026
What do you like best?

Abfragen kommen schnell zurück. Mit Developer Options und Logging kann vieles nachvollzogen werden. Viele Features sind in Planung.

What do you like least/what could be improved?

Viele der Optionen aus dem Classic BI fehlen noch für Workbooks. Nicht unbedingt funktionelle Optionen, sondern eher optische Dinge (Zeilen abwechselnd färben, default Data Formats für das semantische Modell einstellen).

What key advice would you give to other companies looking to introduce/use the product?

Aktuelle Dokumentation lesen. Ältere Beiträge verweisen häufig auf die Classic-BI-Lösung oder enthalten veraltete Informationen.

How would you sum up your experience?

Komplizierter Start, da dies das erste Projekt von mir in dieser Richtung war.

Role
Consultant
Number of employees
Mehr als 2.500
Industry
Process industry
Source
BARC Marketing, AI & Analytics Survey 27, 04/2026
What do you like best?

The data visualization interface is modern, agile, fast, elegant, and web-based. It offers many functionalities, all of which are fantastic compared with more static reporting.

What do you like least/what could be improved?

There is a lack of options for graphic axes, the colours are poor, titles cannot be moved easily, and formatting axis information is difficult. The Explain option for a column is not ideal. I would like to be able to select a function for Explain other than COUNT(1), such as SUM(sales), for example. I know I can change this by editing each formula, but this is cumbersome. Explain fails when there are more than 60,000 rows to analyse in my installation. I suppose this works better in OCI. I do not see any speedometer indicators. The pivot table does not offer the best formatting options when creating a pivot. When using a semaphore indicator based on a column value, you cannot colour the complete row based on that value; you can only colour the column. The filters on pages are not very user-friendly. Too many errors have no explanation and simply display a blank error message. The automatic insight runs but says, “Nothing important to show,” for all my datasets. I would like to understand the context of data calculations better. For example, how does SUM(col1)/SUM(col2) work for each row, subtotal, and total? Is it possible to calculate SUM(col1 for each city)/SUM(col1 for all cities)? This involves a combination of row-level and total-level calculations. Can we manage this kind of calculation? For me, it has been difficult to understand the many options available for graphics.

What key advice would you give to other companies looking to introduce/use the product?

Analytics is the evolution for OBIEE, but much more. The ML, predictive algorithms are very powerful, some things like natural language (on speaking) is fantastic, OAS runs very fast in my laptop (OAD not the same).

How would you sum up your experience?

I love Oracle, and I love Oracle Analytics. I’m looking forward to new features and improvements, as Oracle Analytics has strengths in governance, design for enterprise environments, and strong database engine support, now with AI, vector, and machine learning options. I think Oracle Analytics has a very good chance of being number one in this type of tool.

Role
Line of business employee
Number of employees
100 - 2.500
Industry
Construction
Source
BARC Marketing, AI & Analytics Survey 27, 04/2026
What do you like best?

ERP integration.

What do you like least/what could be improved?

Report editing and formatting can be somewhat time-consuming.

What key advice would you give to other companies looking to introduce/use the product?

Before using it, the base information must be organized and structured to ensure adequate analysis.

How would you sum up your experience?

Easy to use, but with room for improvement; it also ensures data integrity and reliability.

Role
IT employee
Number of employees
Mehr als 2.500
Industry
Manufacturing
Source
BARC Marketing, AI & Analytics Survey 27, 04/2026
What do you like best?

Single source of truth.

What do you like least/what could be improved?

Too many changes and developments are happening on the roadmap, and it is all moving very fast

What key advice would you give to other companies looking to introduce/use the product?

The product is great, and selecting the right implementer is also a crucial decision.

How would you sum up your experience?

We have a lot of hope, a long-term roadmap, and we are excited about our decision.

Role
Line of business employee
Number of employees
Mehr als 2.500
Industry
Retail
Source
BARC Marketing, AI & Analytics Survey 27, 04/2026
What do you like best?

It is very easy to use and learn and is seamlessly and reliably integrated with Fusion HCM.

What do you like least/what could be improved?

AI functions aren't always clear or easy to access. In reality, my main problems are with how the business has chosen to roll it out rather than with the product itself.

What key advice would you give to other companies looking to introduce/use the product?

It's an amazing product if you can fully commit to a business-wide implementation.

How would you sum up your experience?

It's a great piece of software, and I can see the advantages over Power BI and Tableau.

Role
IT employee
Number of employees
Mehr als 2.500
Industry
IT
Source
BARC Marketing, AI & Analytics Survey 27, 04/2026
What do you like best?

Data visualization.

What do you like least/what could be improved?

Simplify the security concepts.

What key advice would you give to other companies looking to introduce/use the product?

Kindly use Oracle Analytics; don’t judge it without using it.

How would you sum up your experience?

It is a good data visualization tool.

Role
Head of a separate BI/analytics organization unit
Number of employees
Mehr als 2.500
Industry
Insurance
Source
Invited by the vendor, The BI & Analytics Survey 26, 06/2025
What do you like best?

It has a lot of potential, but the data organization and clean data have to support the front-end capabilities. Creating simple dashboards is easy.

What do you like least/what could be improved?

Reporting with any amount of formatting is cumbersome. It is also somewhat expensive to put in the hands of too many people.

What key advice would you give to other companies looking to introduce/use the product?

Make sure you ask them to show you a system at another company implemented with similar data structures, feeds, complexity of formatted data, as well as sheer size of data.

How would you sum up your experience?

It's a nice tool if you want quick dashboards without a lot of complexity.

Role
Project manager for BI/analytics from IT
Number of employees
Mehr als 2.500
Industry
Services
Source
BARC Panel, The BI & Analytics Survey 26, 04/2025
What do you like best?

Simple but powerful.

What do you like least/what could be improved?

–

What key advice would you give to other companies looking to introduce/use the product?

Build a proof of concept first.

How would you sum up your experience?

Very good tool. Not the most powerful, maybe, but quite easy and fast to create solutions that deliver value to users.

Role
IT employee
Number of employees
Mehr als 2.500
Industry
Education
Source
BARC Marketing, The BI & Analytics Survey 26, 06/2025
What do you like best?

Accommodates a variety of sources and allows data transformations within the tool using data flows.

What do you like least/what could be improved?

Some features that should be basic requirements are not available (i.e., user/role reports, data lineage reports, ordering prompts, etc.). For users, navigation can be confusing—for example, right-clicking to go to drill-down reports.

What key advice would you give to other companies looking to introduce/use the product?

Solid option that can likely accommodate an organization's primary needs. Implementation will require technical expertise in the tool. Once implemented, functional users may be able to create their own datasets and build reports.

How would you sum up your experience?

Generally good.

Role
Employee of a cross-departmental BI/analytics team
Number of employees
100 - 2.500
Industry
Consulting
Source
BARC Marketing, The BI & Analytics Survey 26, 06/2025
What do you like best?

Ease of access, integration with client requirements, and fast, efficient delivery of deployments.

What do you like least/what could be improved?

–

What key advice would you give to other companies looking to introduce/use the product?

Working as an Oracle Analytics consultant for six years, I have come across many challenges in client deliverables. There have been times when a few things couldn't go as planned due to roadblocks in implementation. Oracle Analytics helps me achieve those with a clear solution offering platform. I would always recommend using Oracle Analytics for any analytics solutions.

How would you sum up your experience?

Reliable, fast, and accurate in delivering data; less time needed to adapt any analytics skills across Oracle.

Role
Head of a separate BI/analytics organization unit
Number of employees
Mehr als 2.500
Industry
Construction
Source
Invited by the vendor, The BI & Analytics Survey 26, 05/2025
What do you like best?

Great product. Checks all the boxes for an enterprise-level BI solution.

What do you like least/what could be improved?

There can be a performance issue when using subject areas with many attributes.

What key advice would you give to other companies looking to introduce/use the product?

Spend appropriate time upfront planning data and reporting requirements.

How would you sum up your experience?

Very satisfied.

Role
Project manager for BI/analytics from IT
Number of employees
Mehr als 2.500
Industry
IT
Source
BARC Panel, The BI & Analytics Survey 26, 05/2025
What do you like best?

Integrated with Oracle OCI.

What do you like least/what could be improved?

Runs only on OCI.

What key advice would you give to other companies looking to introduce/use the product?

If they have Oracle tech and Cloud ERP from Oracle, then it is easier to use.

How would you sum up your experience?

Overall, a robust product with a good metadata modeler.

Role
Project manager for BI/analytics from IT
Number of employees
100 - 2.500
Industry
Healthcare
Source
BARC Panel, The BI & Analytics Survey 25, 04/2024
What do you like best?

Gute Integration der Funktionen ohne Brüche. Guter Funktionsumfang für klassisches BI.

What do you like least/what could be improved?

-

What key advice would you give to other companies looking to introduce/use the product?

Definieren Sie zuerst aus der Führung die Anforderungen und Szenarien und warten Sie nicht auf alle Fachbereiche. Fangen Sie in einem Fachbereich an. Controlling muss die Einführung leiten. Bauen Sie als Zentrum auf eine RDBMS/DWH als Datenquelle, wenn ERP-Daten ausgewertet werden sollen. Wenn hierfür schon Oracle-Wissen/-Software vorhanden ist benötigt man keine zusätzliche Architektur. Bei anderen Vorraussetzungen prüfen Sie Alternativen.

How would you sum up your experience?

Das Problem ist fast nie die Software, sondern verschüttetes Wissen in Excel inkl. Blödsinn plus anfängliches Desinteresse in den Fachbereichen. Entscheidend für die Proliferation im Unternnehmen ist der zentrale BI-Funktionsumfang ohne Systembrüche, wo uns Oracle Analytics Cloud bis jetzt nicht im Stich gelassen hat.

Role
Project manager for BI/analytics from business department
Number of employees
Mehr als 2.500
Industry
Healthcare
Source
Invited by the vendor, The BI & Analytics Survey 25, 05/2024
What do you like best?

As an analytics professional with over 30 years of experience, I can confidently say that Oracle Analytics Cloud is the most versatile analytics platform I have ever used. Its ability to consolidate all ERP data into one centralized location is a game-changer. With Oracle Analytics Cloud, users can seamlessly perform self-service visualizations and create high-pixel traditional reporting dashboards, making data analysis and reporting more intuitive and efficient. One of the standout features of Oracle Analytics Cloud is its cloud-based nature. This eliminates the need to worry about software updates, as they are managed automatically, ensuring that we always have access to the latest features and improvements. This significantly reduces the administrative burden, allowing a single full-time equivalent (FTE) to efficiently manage the entire system. The development cycle with Oracle Analytics Cloud is remarkably fast, enabling quicker turnaround times for analytics projects and facilitating agile responses to business needs. On a daily basis, I find myself relying on Oracle Analytics Cloud to enhance my work, which, in turn, positively impacts the overall performance of my organization. Oracle Analytics Cloud's robust capabilities and user-friendly interface make it an indispensable tool for any analytics professional. I wholeheartedly recommend Oracle Analytics Cloud to anyone seeking to improve their data analysis, reporting processes, and overall organizational efficiency.

What do you like least/what could be improved?

The only downside I've encountered with Oracle Analytics Cloud is that I don't have enough time to fully explore all of its extensive features. From data modeling and creating datasets for data preparation to reporting, online data visualization, and scheduling, Oracle Analytics Cloud offers a wide range of capabilities. However, I find it challenging to utilize all these features due to time constraints. It’s important to note that there is a learning curve associated with mastering Oracle Analytics Cloud. It takes some time to understand how to fit the product into your specific data environment and to determine the most appropriate data visualizations for effective use. Despite this, the effort invested in learning the platform is well worth it, as it significantly enhances data analysis and reporting processes. Overall, while it may take some time to fully harness the power of Oracle Analytics Cloud, its comprehensive feature set and potential for improving data-driven decision-making are undeniable.

What key advice would you give to other companies looking to introduce/use the product?

Oracle Analytics Cloud is a highly scalable analytics tool, suitable for every IT analyst. Its flexible subscription model and cloud infrastructure allow you to easily scale your usage from minimal to extensive as your needs grow. This scalability ensures that Oracle Analytics Cloud can adapt to the changing demands of your organization, making it an invaluable asset for data analysis and reporting.

How would you sum up your experience?

Oracle, a leading software company, brings its extensive expertise in databases and reporting to Oracle Analytics Cloud. As a cloud-based platform, Oracle Analytics Cloud leverages Oracle's renowned capabilities, offering robust database management, comprehensive reporting tools, and a wealth of shared knowledge. Its adaptability ensures it can meet future demands, making it a forward-thinking choice for any organization seeking advanced analytics solutions.

Role
Project manager for BI/analytics from business department
Number of employees
Mehr als 2.500
Industry
Services
Source
Invited by the vendor, The BI & Analytics Survey 25, 05/2024
What do you like best?

Oracle cloud provides great support and great leading technology to support the movement of BI tools.

What do you like least/what could be improved?

Currently the performance of loading a large detail table is taking too long. When using multiple facts and dimensions there is a big slow down that we have notice.

What key advice would you give to other companies looking to introduce/use the product?

Oracle cloud has not just great resources, but the community in itselfs is one thing that I am proud to be a part of.

How would you sum up your experience?

This is an overall great product that if the performance is fixed and the momentum keeps up, will be the leading platform in BI tools.

Role
Employee of a cross-departmental BI/analytics team
Number of employees
Mehr als 2.500
Industry
Banking and finance
Source
Invited by the vendor, The BI & Analytics Survey 25, 05/2024
What do you like best?

Iin comparison with the built-in OTBI tool in sales cloud it is much more flexible in building data models, subject areas and applying business logic.

What do you like least/what could be improved?

Upgrades tend to initiate issues and solved issues cause new issues. The tool is still in a lot of development and that makes it not 100% reliable.

What key advice would you give to other companies looking to introduce/use the product?

Oracle Analytics Cloud is a great tool and has added value for your organisation if your audience is actually using the dashboard. As a tool for exporting data (which most users do), it is to valuable.

How would you sum up your experience?

Great tool with lots of flexibility for data modelling and ideal native connection with the fusion cloud instances.

Role
Line of business employee
Number of employees
100 - 2.500
Industry
Media/Publishing
Source
Invited by the vendor, The BI & Analytics Survey 25, 05/2024
What do you like best?

Licence de type serveur (et pas nommées), licence complète pour tout utilisateur, pas de client lourd (interface web pour toutes les fonctionnalités), larges possibilités de diffusion et de partage, modèle sémantique (BI mode 1) & ensembles de données créés par les utilisateurs des directions métier (BI mode 2).

What do you like least/what could be improved?

Connexions à toutes les sources de données pas toujours bien prises en compte, limitation du nombre d'enregistrements renvoyés par une requête (2000000 pour 4 OCPU par exemple).

What key advice would you give to other companies looking to introduce/use the product?

Vérifier l'efficacité des connexions à certaines sources (Redshift par exemple).

How would you sum up your experience?

Excellent rapport qualité prix pour une entreprise avec des centaines d'utilisateurs.

Role
Project manager for BI/analytics from IT
Number of employees
Mehr als 2.500
Industry
Public sector
Source
Invited by the vendor, The BI & Analytics Survey 25, 05/2024
What do you like best?

Frequent product updates.

What do you like least/what could be improved?

The classic interfaces are more suitable for enterprise dashboard type uses but don't have the visual appeal of DV. DV doesn't quite have the capability to effectively deliver enterprise dashboards yet.

What key advice would you give to other companies looking to introduce/use the product?

-

How would you sum up your experience?

Good product, good support, roadmap is impressive.

Role
Project manager for BI/analytics from IT
Number of employees
100 - 2.500
Industry
Services
Source
Invited by the vendor, The BI & Analytics Survey 25, 05/2024
What do you like best?

Simple, very intuitive, no need to install anything. Works well with Oracle ADW.

What do you like least/what could be improved?

Some calculations are not intuitive.

What key advice would you give to other companies looking to introduce/use the product?

Go to an Oracle Analytics Summit event and speak with a customer.

How would you sum up your experience?

Very good.

Role
Director HRIS
Number of employees
Mehr als 2.500
Industry
Services
Source
Invited by the vendor, The BI & Analytics Survey 25, 05/2024
What do you like best?

Flexibility & integrations, some good visualizations.

What do you like least/what could be improved?

Ease of use for functional users, data validation and accuracy of the data.

What key advice would you give to other companies looking to introduce/use the product?

Initial data validation is a big challenge to trust the data completely.

How would you sum up your experience?

Good product but needs solid SME's to understand the needs of analytics.

Role
Head of a separate BI/analytics organization unit
Number of employees
Mehr als 2.500
Industry
Construction
Source
Invited by the vendor, The BI & Analytics Survey 25, 06/2024
What do you like best?

Ease of use and continuously improving / engagement by product development team.

What do you like least/what could be improved?

Overall cost.

What key advice would you give to other companies looking to introduce/use the product?

It is a great tool, work with your c-suite to plan how much/which content will be the main focus.

How would you sum up your experience?

Highly recommend it.

Survey Information
Number of reviews for Oracle Analytics Cloud
21
Reviewed versions
Peer groups in the survey
Large/Enterprise-Wide Implementations, Report & Dashboard Focus, Analysis Focus, International BI Giants
Don‘t miss out!
Join over 25,775 data & analytics professionals and get the latest product insights, research, surveys and more!
DATA festival Munich. Experience Data & AI with the community shaping what’s next.