Softwarezertifizierung von BARC und Hichert
BARC und HICHERT+PARTNER bestätigen, dass das Excel-Add-In Chart-me 2.1 von der HI-CHART GmbH die Prüfung im Rahmen des HICHERT®IBCS Software-Zertifizierungsprozesses erfolgreich bestanden hat. Diese Zertifizierung bezieht sich auf die visuelle Gestaltung von Geschäftsdiagrammen nach den von der IBCS Association empfohlenen Standards.
Dr. Rolf Hichert, Mitglied im Zertifizierungsteam, kommentierte die Zertifizierung von Chart-me wie folgt: „Mich hat überzeugt, wie Diagrammdetails mit reiner Excel-Funktionalität pixelgenau realisiert werden können – ohne zusätzlich erforderliche Programmierung. Ich sehe vor allem bei der Gestaltung von anspruchsvollen Geschäftsdiagrammen in PowerPoint-Präsentationen, in Word-Berichten und in Redaktionssystemen die besonderen Vorteile für den Einsatz dieses Excel-Add-Ins.“
Chart-me
Mit dem Excel-Add-In Chart-me können Berichte und Präsentationen basierend auf HICHERT®SUCCESS und IBCS schnell und in sehr hoher Qualität umgesetzt werden. Mit Hilfe der vielen vordefinierten Seitenlayouts und Diagrammtypen entstehen innerhalb weniger Minuten erste Ergebnisse. Bei Bedarf können dann individuelle Einstellungen vorgenommen werden.
Auch spätere Anpassungen sind mit der Chart-me Benutzeroberfläche kein Problem. Alle IBCS-typischen Elemente lassen sich ganz einfach per Mausklick erzeugen: Spezielle Diagrammtypen, Abweichungsanzeigen, Hervorhebungen, Farblogik, Skalierungssteuerung und viele mehr. Sogar das maßstabsgetreue Vergrößern und Verkleinern von Diagrammen in Abhängigkeit von der Schriftgröße funktioniert bei Chart-me automatisch.
Da die Diagramme beliebig kombiniert (überlagert) werden können, entsteht eine riesige Anzahl von Darstellungsmöglichkeiten. Alle gängigen Inhalte lassen sich damit hervorragend abdecken. Die fertigen Berichts- und Präsentationsseiten werden als reine Excel-Dateien gespeichert. Die Grafiken lassen sich jederzeit auch ohne das Add-In anzeigen und aktualisieren.
Nach der Installation erscheint Chart-me als zusätzliches Menü in Microsoft Excel 2007/2010/2013 und kann sofort verwendet werden.
NEUES CHART-ME XLS 2.1 TABELLENMODUL
Für aussagekräftige Geschäftsberichte sind Tabellen genauso wichtig wie Diagramme. Und wenn beide die selbe Sprache sprechen, ist das Verständnis für die Berichtsempfänger besonders einfach. Die Bedienung erfolgt dabei auf gewohnte Weise über Excel-Zellen. Hier können Sie Werte einfach eingeben oder aus nahezu jeder beliebigen Datenquelle verknüpfen.
Features des neuen Tabellen-Moduls
Das neue Tabellenmodul von Chart-me XLS 2.1 erstellt Zeitreihen, Strukturtabellen mit und ohne hierarchische Ansicht sowie Kombinationen aus beiden.
Das Ergebnis ist wie auch in den Chart-me XLS Diagrammen eine reine Excel-Datei.
Die Tabellen werden durch die Verwendung von Stylesheets an Ihr Notationskonzept angepasst.
Funktionen und Workflow
Die Idee von Chart-me: Sie haben Ideen oder Entwürfe für neue Berichts- oder Präsentationsseiten und wollen so schnell wie möglich zum Ergebnis kommen.
Mit wenigen Mausklicks wählen Sie im Chart-me-Menü die vordefinierten Grafiken, die Ihrem gewünschten Ergebnis am ähnlichsten sind. Dann komplettieren Sie die Seiten – je nach Bedarf – mit individuellen Detaileinstellungen. Im Gegensatz zu früheren Excel-Templates konzentrieren Sie sich dabei voll auf Inhalte, Gestaltungsvorgaben und Seiteneinteilung, nicht auf Datenreihen oder Diagrammtricks.
In der Regel wird zuerst ein Seitenlayout ausgewählt. Die vorbereiteten Vorlagen sind für die wichtigsten Ausgabeformate optimiert:
- Bildschirm, für PowerPoint
- Papier, für A4 und A3, jeweils hoch und quer
Die Layouts können selbstverständlich auch verändert werden. Später speichert Chart-me die Position und Größe jedes Diagramms innerhalb des Layouts. Die Einstellung kann dann jederzeit mit einem Klick wiederhergestellt werden. Das ist sehr nützlich, wenn Sie standardisierte Grafiken umsetzen möchten, da jede (auch versehentliche) Verzerrung das Ergebnis stören würde.
Als nächstes werden die gewünschten Diagramme eingefügt. Die vordefinierten Typen sind gemäß IBCS-Regelwerk in drei Gruppen unterteilt:
- Horizontale Achse, für zeitliche Entwicklungen
- Vertikale Achse, für Strukturanalysen, Verhältnisse, Sortierungen
- X-Y-Achsen, für Korrelationen und Portfolios
Für horizontale und vertikale Rubriken-Diagramme sind folgende Varianten vordefiniert:
- Säulen/Balken
- Säulen/Balken versetzt neben- oder hintereinander
- Säulen/Balken mit integrierten Abweichungen
- Säulen/Balken gestapelt
- Säulen/Balken als Wasserfall
- Säulen/Balken als Spannen
- Punkte mit oder ohne Verbindungslinie
- Punkte mit Verbindungslinien als Wasserfall
- Nadeln
- Linien
Für XY-Diagramme sind verschiedene Punkt- und Portfoliovarianten verfügbar.
Bei vielen Basisdiagrammen lassen sich zusätzliche Abweichungsdiagramme aktivieren.
Pro Hauptdiagramm sind dabei bis zu zwei Abweichungsdiagramme möglich, z. B. absolut und prozentual.
Folgende Abweichungsdarstellungen sind vordefiniert:
- Säulen/Balken rot/grün oder uni
- Säulen/Balken als Wasserfall
- Nadeln (Prozent-Abweichung)
- Blasen (Prozent-Abweichung als Fläche)
- Säulen und Nadeln kombiniert
Alle vordefinierten Typen lassen sich außerdem in jedem Detail konfigurieren und auch miteinander kombinieren (überlagern). Dadurch ist praktisch jeder Gestaltungswunsch erfüllbar.
Neben den Grafiktypen ist Chart-me mit einer Reihe weiterer Funktionen ausgestattet, die sich bei der Umsetzung IBCS-konformer Berichtslösungen vielfach bewährt haben:
- Skalierungssteuerung (Gruppierung von Diagrammen, Lupendarstellung)
- Skalierungsindikatoren (Flächen, Linien)
- Schriftgrößenkonzept (maßstäbliches Vergrößern/Verkleinern passend zur Schriftgröße)
- Stylesheets (Gestaltungsvorgaben für alle Grafiken zentral steuern)
- Differenzanzeigen (Hervorhebung in Diagrammen)
- Freie Texte, Punkte und Linien
- Formellogik in Excel-Zellen (individuelle Verknüpfung von Daten und Steuerungsparametern)
- Die Anwendung ist mehrsprachig und kann zwischen Deutscher und Englischer Sprache umgeschaltet werden.
Für eine individuelle Beratung wenden Sie sich bitte an Holger Gerths.
Beispiele
Die anspruchsvollen Muster-Schaubilder unter HI-CHART-TEMPLATES ’14 entsprechen den im Rahmen der Zertifizierung umzusetzenden Templates. Sie wurden mit Chart-me in Excel umgesetzt.
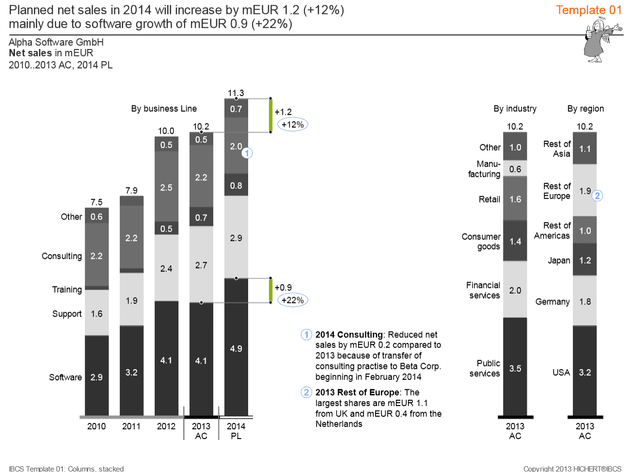
Template 1 – Stacked columns
Stacked columns are being used for many practical analyses for displaying data in their temporal development. This chart type can be used best, if not more than five or six data series with little changes within one data series for not more than 10 or 20 time periods are presented. Disadvantages of this chart type are: If at all, only very few negative values can be presented; the temporal development of only the lowest data series can be analyzed well. If certain data points are missing, the labeling and the analysis is difficult.
Required features are: Proper scaling of several charts on one page and on more than one page; integrated legends at the left or right hand side of the column data points; period sums outside at the top of each column; consistent title and footnote concept; use of category axes for meaning (“semantic axes”).
Optional features are: Message concept; showing differences; integrating and highlighting comments; suppress data labels of small values.
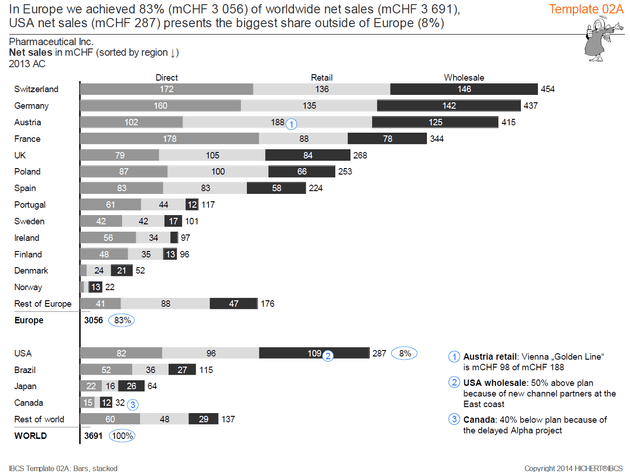
Template 2 – Stacked bars
Stacked bars are being used for many practical analyses for displaying the structure of data in a given time period or at a given point of time. This chart type can be used best, if not more than five or six data series with little changes within one data series for not more than 10 or 20 structure elements are presented. Disadvantages of this chart type are: If at all, only very few negative values can be presented; the structure of only the lowest data series can be analyzed well. If certain data points are missing, the labeling and the analysis is difficult.
Required features are: Proper scaling of several charts on one page and on more than one page; integrated legends at the left or right hand side of the column data points; sums outside of the bars; consistent title and footnote concept.
Optional features are: Message concept; showing differences; integrating and highlighting comments; suppress data labels of small values.
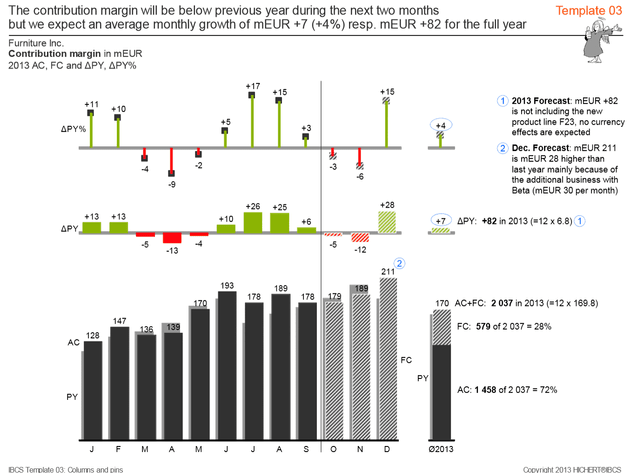
Template 3 – 3-tier column chart
This template compares different scenarios in a grouped column chart (first tier). The second and third tiers show different absolute and relative variance charts. E.g. these 3-tier charts are being used to analyze the temporal development of different data categories. This chart type can be used best, if two data categories for not more than 10 or 20 time periods are presented.
Required features are: Proper scaling of charts with the same unit (value, volume, shares, ratios) on one page and on more than one page; legends at the left or right hand side of the data series; value labels above or below the visualizers; red and green variances; pins for percent variances, columns for absolute variances; notation concept for columns showing different categories; consistent title and footnote concept.
Optional features are: Message concept; integrating and highlighting comments.
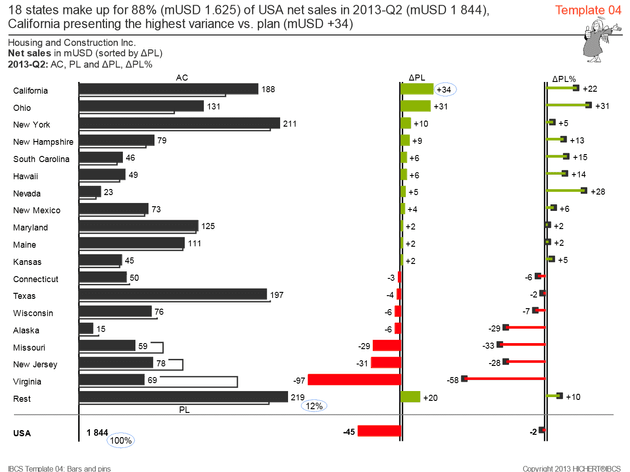
Template 4 – 3-tier bar chart
This template compares different scenarios in a grouped bar chart (first tier). The second and third tiers show different absolute and relative variance charts. E.g. these 3-tier charts are being used to analyze the data structure of different categories. This chart type can be used best, if two data categories for not more than 10 or 20 structure elements are presented.
Required features are: Proper scaling of charts with the same unit (value, volume, shares, ratios) on one page and on more than one page; legends above or below the data series; value labels at the right or left hand of the visualizers; red and green variances; pins for percent variances, bars for absolute variances; notation concept for bars showing different categories; consistent title and footnote concept.
Optional features are: Message concept; integrating and highlighting comments.
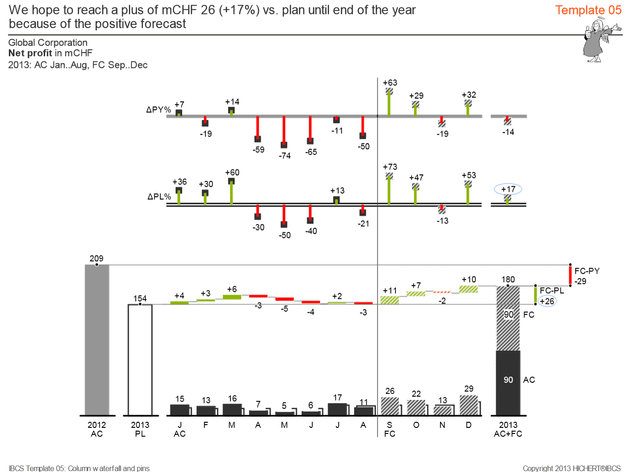
Template 5 – Horizontal waterfall chart with relative variances
This template shows a horizontal waterfall with grouped columns for AC (resp. FC) and PL 2013 extended by an additional column for AC 2012 (=PY). Additional tiers show the relative variances to PL and PY.
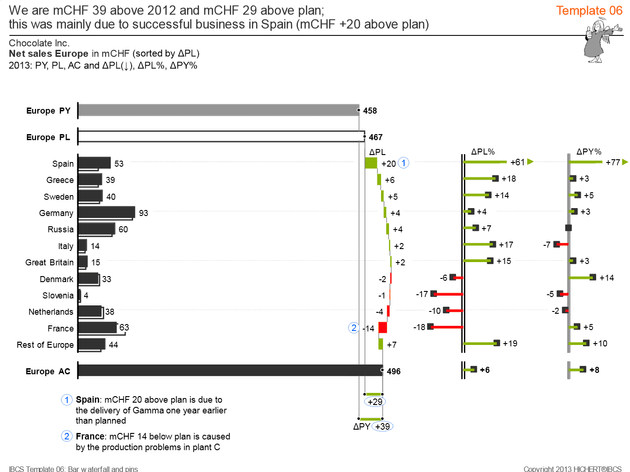
Template 6 – Vertical waterfall with relative variances (sorted)
This template shows a vertical waterfall with grouped bars for AC and PL, sorted by absolute variances to PL and extended by an additional bar for PY. Additional tiers show the relative variances to PL and PY.
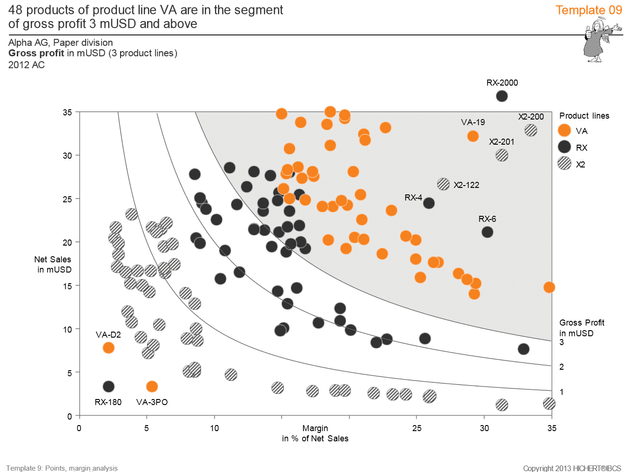
Template 9 – Chart with points and two value axes
This template arranges product points in a chart with two value axes for “Net sales” and “Margin”. The colors of the products points indicate the respective product lines. The plane of the diagram is clustered by lines of equal “Gross profit”.
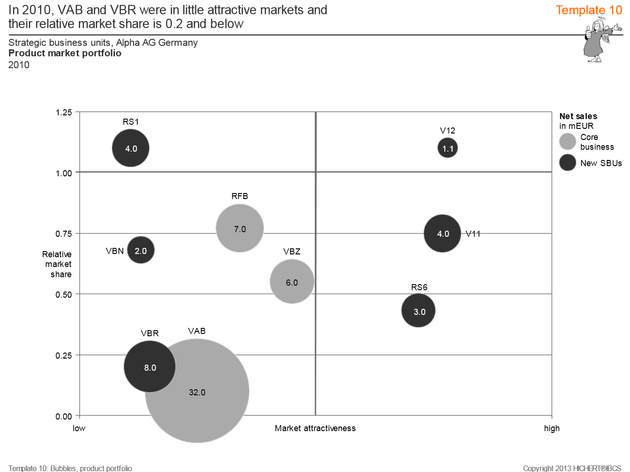
Template 10 – Portfolio chart with bubbles
This template shows another example of a chart with two value axes: Bubbles for products are arranged in a coordinate system for “Market attractiveness” and “Relative market share”. The Size of the bubbles corresponds to the “Net sales” of the respective product.
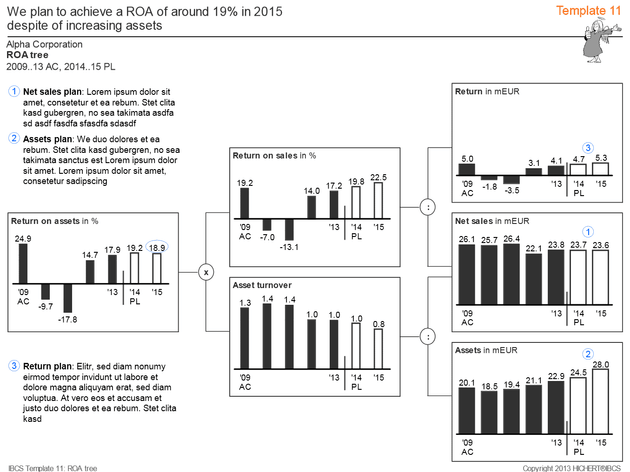
Template 11 – Ratio tree
This template shows the calculation of „Return on assets“ from „Return“, „Net sales“ and „Assets“ in a two-step calculation schema.
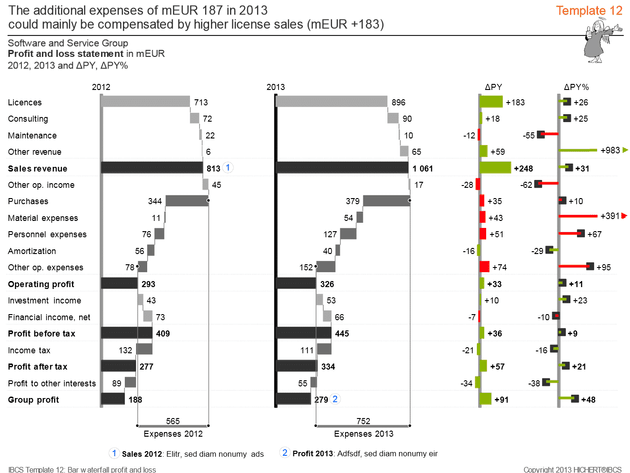
Template 12 – Vertical waterfall for a calculation schema
This template shows a vertical waterfall for a calculation schema with additional tiers showing the waterfall for PY and the corresponding absolute and relative variances.
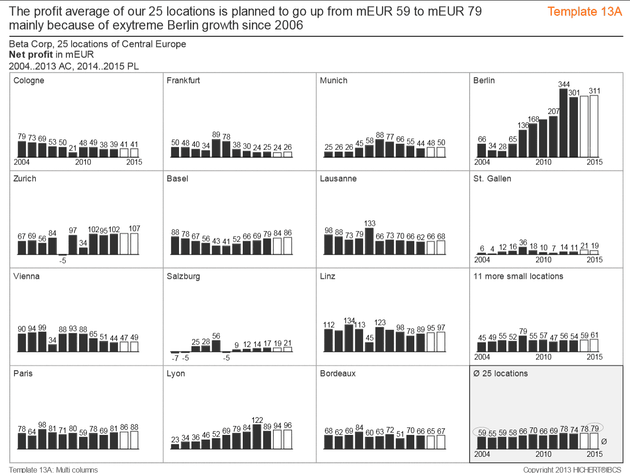
Template 13 – Small multiples of column charts
This template shows the variance of AC and PL data from location average for various locations in small multiples of column charts.
